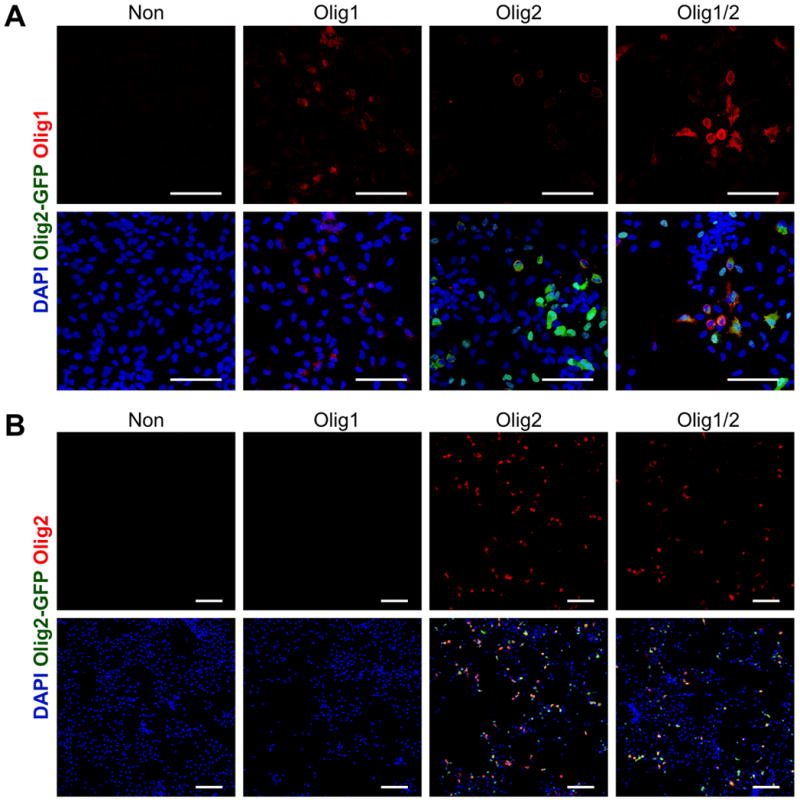
Figure 2. Nanoparticle-mediated Olig1 and Olig2 expression on hNSCs.

(A) Olig1 (red) expression in hNSCs after transfection with PBAE 536 nanoparticles containing plasmid encoding Olig1, plasmid encoding Olig2-GFP, or the mixture of these two plasmids (Olig1/2; 0.5 μg/cm2 Olig1 and 0.5 μg/cm2 Olig2-GFP, respectively) at the polymer/DNA ratio of 20 w/w and the DNA dose of 1 μg/cm2 on day 2. (B) Olig2 (red) expression in hNSCs after transfection with PBAE 536 nanoparticles containing plasmid encoding Olig1, plasmid encoding Olig2-GFP, or the mixture of these two plasmids on day 2. Non-transfected cells were used as a control. DAPI was used to stain cell nuclei in blue. Scale bar = 100 μm.
