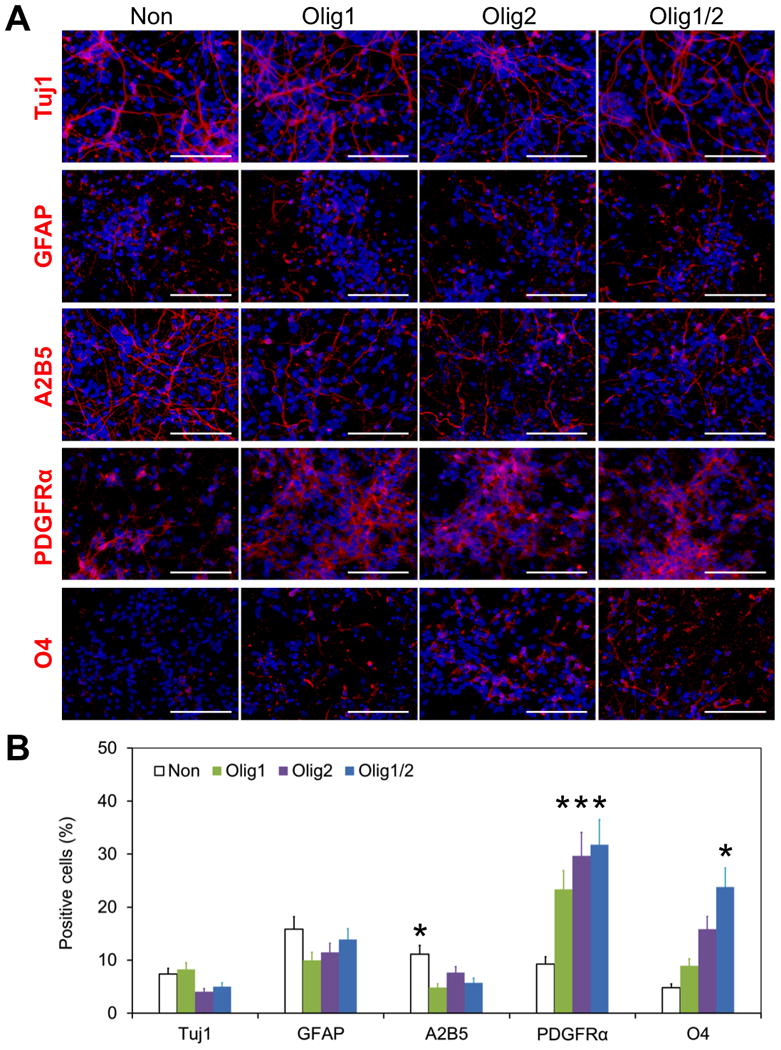
Figure 5. Enhancing oligodendrocyte differentiation by nanoparticle-mediated expression of Olig1 and Olig2.

(A) Differentiation of Olig1, Olig2, and Olig1/2-transfected hNSCs on day 20. Cells were stained with Tuj1 (red), GFAP (red), A2B5 (red), PDGFRα (red), and O4 (red), respectively. Cells without transfection were used as a control. DAPI was used to stain cell nuclei in blue. Scale bar = 100 μm. (B) Quantitative analysis of the differentiation of hNSCs on day 20 (*P < 0.05). The positive cells for each marker were counted. At least 6 random fields per sample were taken for quantitative analysis.
