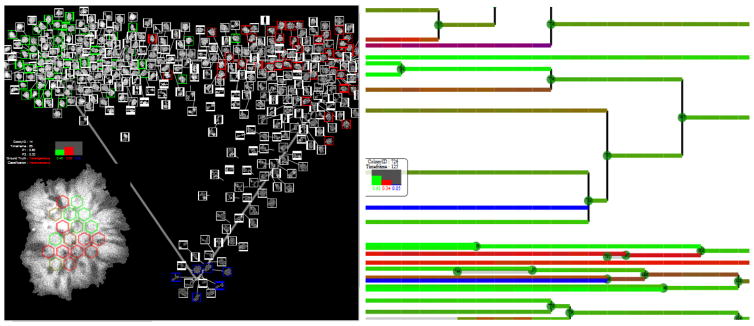
Figure 3.
Left – Interactive visualization of colony images with their hexagonal partitions and classification categories (homogeneous-green, heterogeneous-red and dark-blue). Right – Zoom-able temporal lineage visualization with assigned classification category and probabilities of each category per colony. The three probabilities are color-coded the same way as the lineage lines.

