Figure 8.
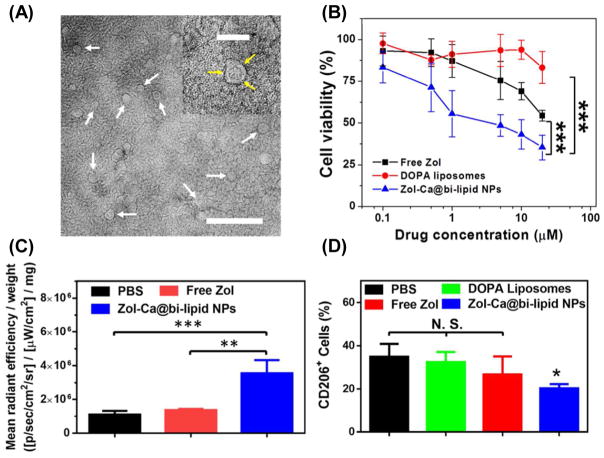
Characterization and in vivo distribution of a new nanoparticle formulation of Zol (i.e. Zol-Ca@bi-lipid NPs). (A) A representative TEM micrograph of the Zol-Ca@bi-lipid NPs after negative staining. The bar represents 200 nm, and Zol-Ca@bi-lipid NPs with clear “core-shell” structure are indicated by white arrows. Shown in inset is the enlarged TEM image of one Zol-Ca@bi-lipid NP (bar = 50 nm) and the mixed lipid layer surrounded on the surface of Zol-Ca complex is indicated by yellow arrows. (B) In vitro cytotoxicity of Zol-Ca@bi-lipid NPs to J774A.1 murine macrophages after 48 h of incubation. Data are mean ± S.D. (n = 6, ***p < 0.001). (C) Mean fluorescent intensity of AF647-labeled Zol in M-Wnt tumors normalized by tumor weight. M-Wnt tumors were collected 24 h after mice were injected (i.v.) with Zol-Ca@bi-lipid NPs, free Zol, or PBS (2% of Zol was labeled with AF647). Data are mean ± S.D. (n = 4, ** p < 0.01, *** p < 0.001). (D) Effects of Zol-Ca@bi-lipid NPs on TAM population in orthotopic M-Wnt mammary tumors. Mice were i.v. injected with Zol-Ca@bi-lipid NPs 36 and 38 days after tumor cell inoculation. As controls, mice were injected with free Zol, PBS, or DOPA liposomes. Forty-eight hours after the second injection, mice were euthanized to collect tumors and the percent of CD206+ cells in tumors was measured using flow cytometry. Data are mean ± S.D. (n = 3,* p < 0.05, as compared to the groups of PBS and DOPA liposomes).

