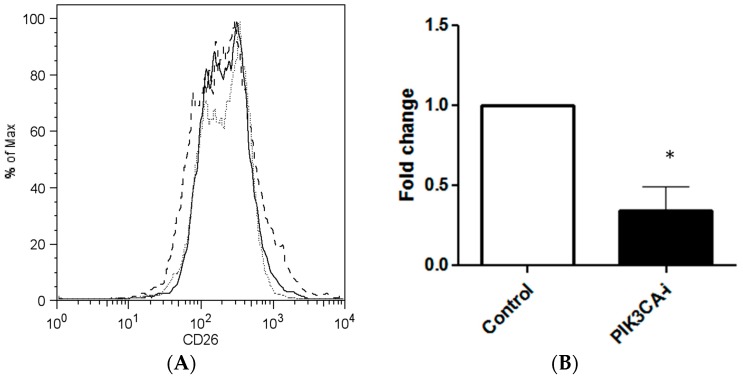
Figure 2.
PIK3CA inhibitor decreases CD26+ stem cell population in colorectal cancer cell line. (A) Representative flow cytometry plots after treatment with PIK3CA-inhibitor in HCT116, showing decrease of CD26+ cell population. Grey dotted line, isotype control. Black dashed line, untreated. Black solid line, treated with PIK3CA-inhibitor. CD26 positivity was defined by >99th percentile of CD26 intensity stained with isotype control. (B) Bar chart shows decrease in CD26+ population after PI3KCA-inhibitor treatment in HCT116 cell line. Bar = Mean + SEM. p = 0.048, n = 3, * p < 0.05.

