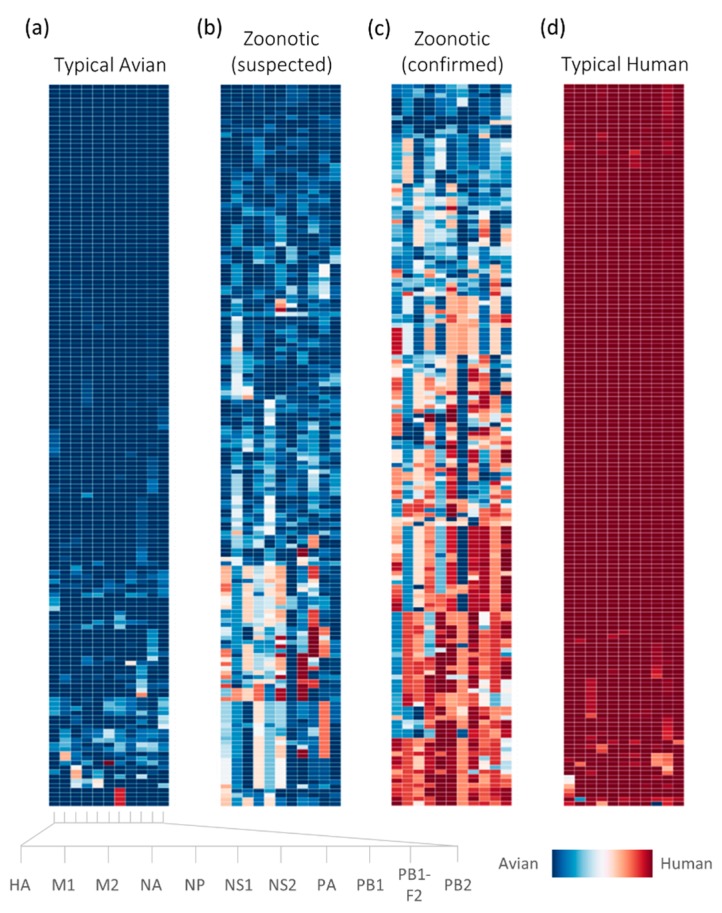
Figure 1.
The dataset used in the study represented by host tropism protein signatures of influenza virus strains: 159 typical avian (a); 160 human-isolated confirmed zoonotic (c), and 164 typical human (d) strains were used in the construction of the zoonotic strain prediction model. Additionally, the signatures of a random 165 of 1047 avian-isolated suspected zoonotic strains (b) subsequently analyzed using the prediction model are also shown. Each individual virus strain in the bar is represented by the host tropism protein signature laid across the row, with the independent predictions of 11 proteins depicted in each column (HA, M1, M2, NA, NP, NS1, NS2, PA, PB1, PB1-F2, and PB2). Avian protein predictions are illustrated in blue, while human proteins are in red. The confidence of the avian or human host tropism prediction is expressed by the intensity of the color, based on the prediction probability estimates found in Supplementary S1 and S2 datasets. HA: hemagglutinin; M1: matrix protein 1; M2: matrix protein 2; NA: neuraminidase; NP: nucleoprotein; NS1: non-structural protein 1; NS2: non-structural protein 2; PA: polymerase acidic protein; PB1: polymerase basic protein 1; PB1-F2: accessory protein F2 translated from PB1 segment; PB2: polymerase basic protein 2.

