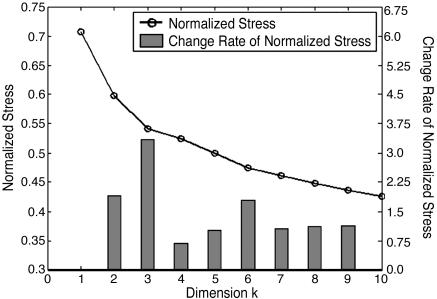
Fig. 1.
Scree plot of the MDS results. A Scree plot evaluates the number of dimensions most appropriate to represent high-dimensional data in a low-dimensional space by means of MDS. To measure how fast normalized stress (NS) diminishes, an empirical parameter called the change rate (CR) is defined as CRk = (NSk - NSk-1)/(NSk+1 - NSk). The k that gives the largest CR indicates the optimal number of dimensions for data abstraction. Here, the largest CR occurs at k = 3. Therefore, the first three dimensions of the MDS projection are used to represent the protein structure space.

