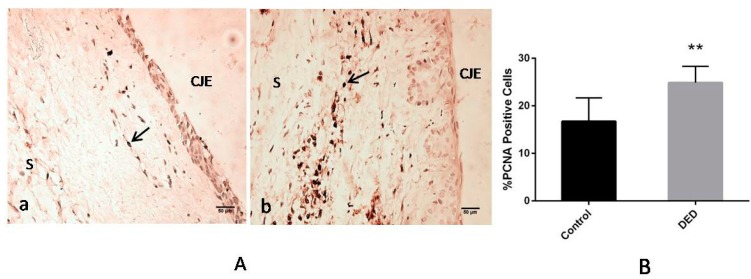
Figure 10.
Proliferating cell nuclear antigen (PCNA) expression in the filtration blebs on day 28. (A) The control group (a) displayed reduced PCNA expression compared with that in the DED group (b) (400×); (B) the percentages of PCNA-positive cells in two groups were significantly different. Black arrows: PCNA-positive cells. CJE: conjunctival epithelium; S: sclera. ** p < 0.01. Scale bar = 50 μm.

