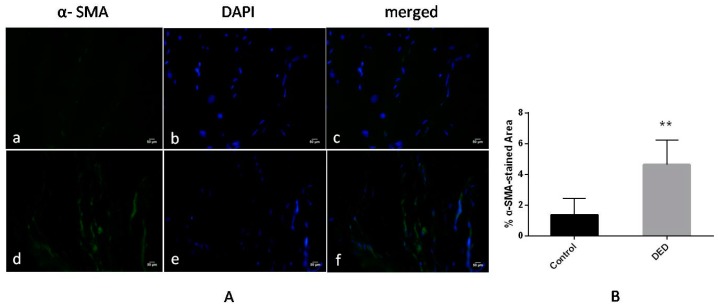
Figure 11.
α-smooth muscle actin (α-SMA) expression in the filtration blebs on day 28 (α-SMA staining: green; nuclear staining: blue). (A) The α-SMA-stained area was larger in the DED group (d–f) than in the control group (a–c) (400×); (B) the percentage of α-SMA-stained area was significantly different between the two groups. ** p< 0.01. Scale bar = 50 μm.

