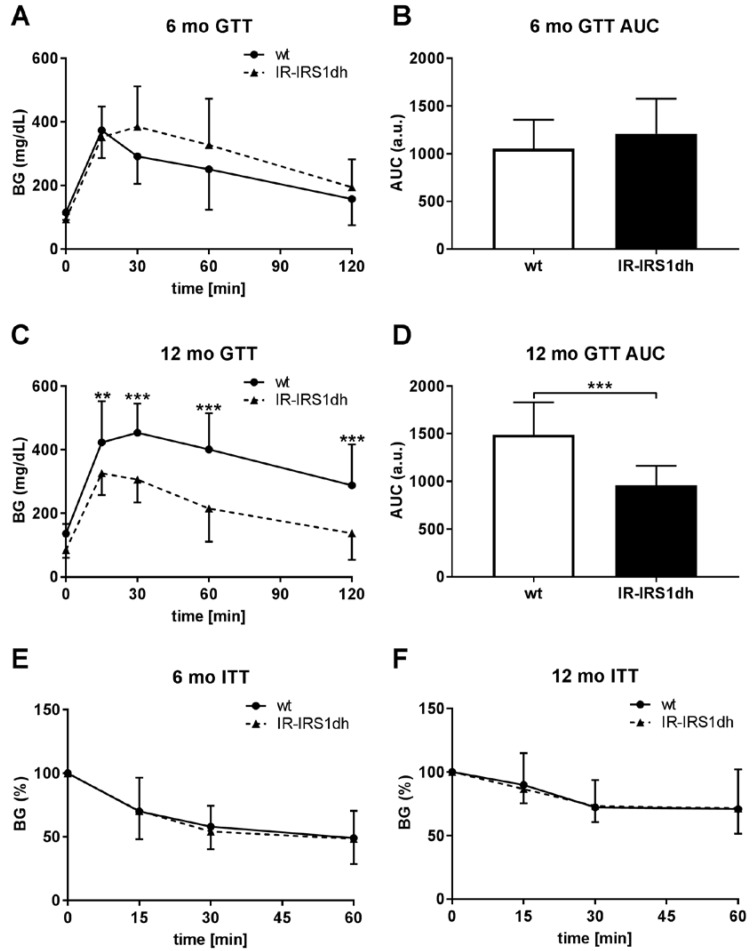
Figure 1.
Glucose and insulin tolerance of IR-IRS1dh mice. (A,C) Blood glucose (BG) levels during intraperitoneal glucose tolerance tests (GTT) and (B,D) area under the curve (AUC) of GTT results. (E,F) Blood glucose levels during insulin tolerance tests (ITT) normalized to 0 min blood glucose levels (100%). Columns and symbols represent mean values ± standard deviation; (A–D) n: 11–24, (E,F) n: 5–13; * denotes significant differences between IR-IRS1dh mice compared to wt controls; ** p < 0.01, *** p < 0.001.

