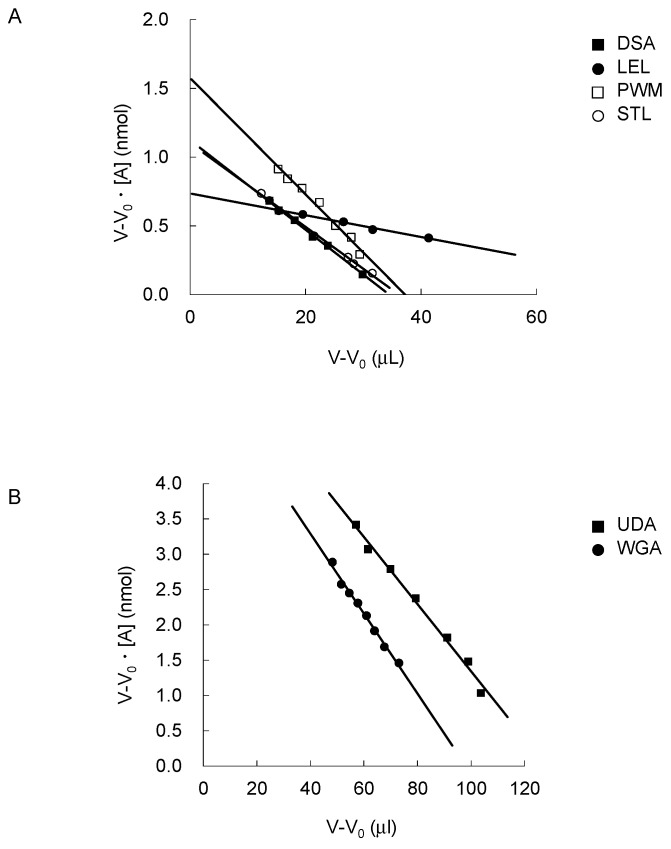
Figure 2.
Woolf-Hofstee-type plots for the determination of Bt values. The results of columns for DSA (closed squares), LEL (closed circles), PWM (open squares) and STL (open circles), and those for UDA (closed squares) and WGA (closed circles) are shown in panels A and B, respectively. For concentration-dependent analysis, appropriate pNP-sugars were used: LacNAc-β-pNP for LEL, UDA, and WGA, chitotetraose-β-pNP for DSA, and chitopentaose-β-pNP for PWM and STL columns. Plots were made by using data, V − V0 vs. (V − V0) [A]0, obtained in the concentration range 2–60 μM. For details, see text.

