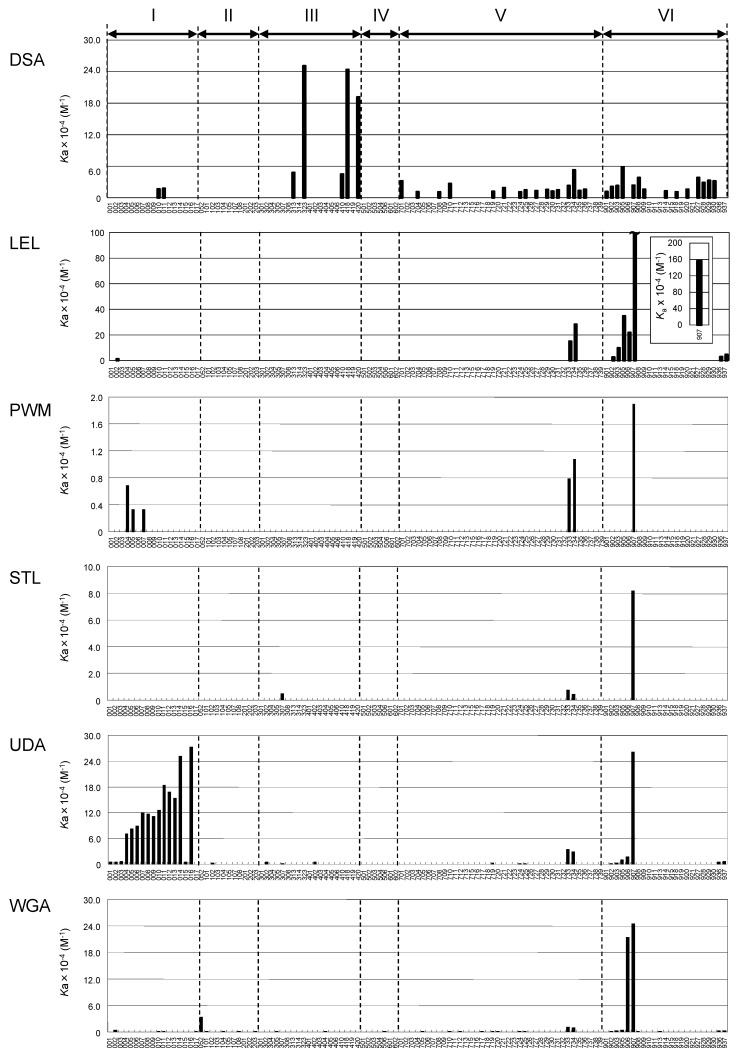
Figure 4.
Bar graph representation of affinity constant (Ka) was made for DSA, LEL, PWM, STL, UDA, and WGA against a panel of PA-oligosaccharides. The small Arabic numbers at the bottom of each graph correspond to sugar numbers indicated in Figure 3, whereas the Roman numerals at the top represent types of glycans, i.e., high-mannose-type (I), agalacto-type (II), asialo-type (III), sialo-type (IV) N-glycans, glycolipid-type glycans (V), and others (VI). For oligosaccharide structures and specifications of the lectin columns, see Figure 3 and Table 1, respectively. Kd values obtained in this analysis are listed in Table S1.

