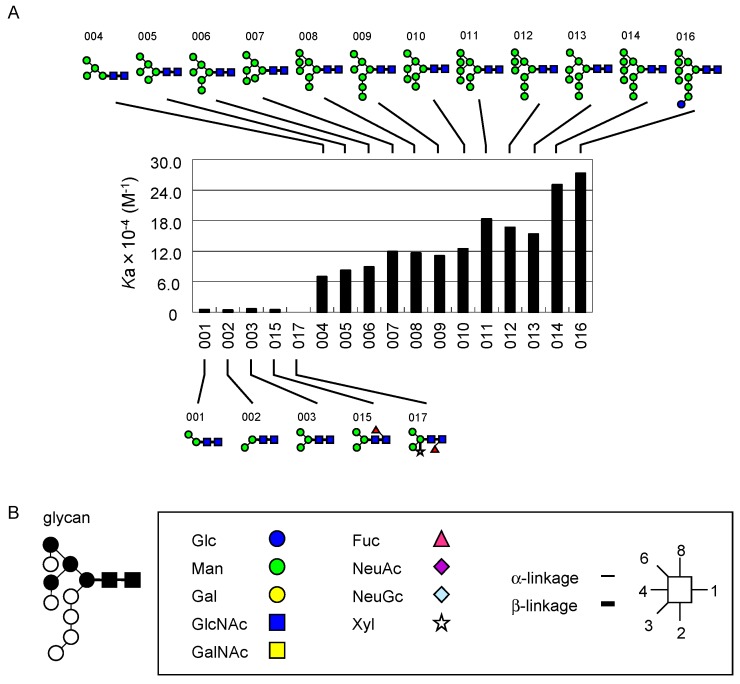
Figure 5.
Featured specificity of UDA for high-mannose-type glycans. Bar graph representation for affinity constant (Ka) in relation to the number of mannose residues (A); Bound and unbound (or weakly bound) glycan structures are shown at the top and bottom of the graph, respectively. Schematic drawings of a high-mannose structure, where essential and non-essential mannose residues are shown in closed and open circles, respectively (B). For carbohydrate structures using symbols, see explanation in the box below as in Figure 3.

