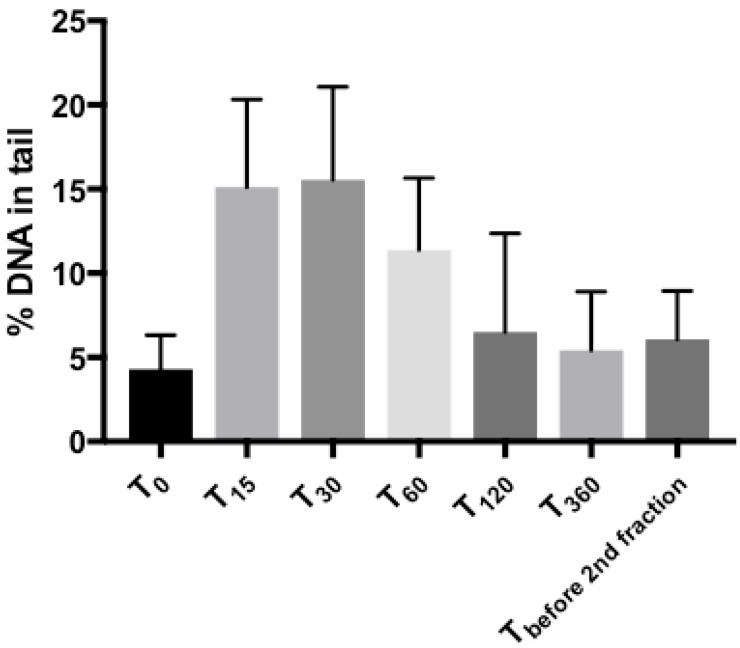
Figure 1.
Time-course of DNA damage measured by comet assay. Tail intensity (%DNA in tail) measured at indicated time-points after completion of radiation treatment (T0–before treatment, T15, T30, T60, T120, T360, minutes after treatment, respectively). Mean values ± SD are shown. Significances in differences are displayed in Table 1.

