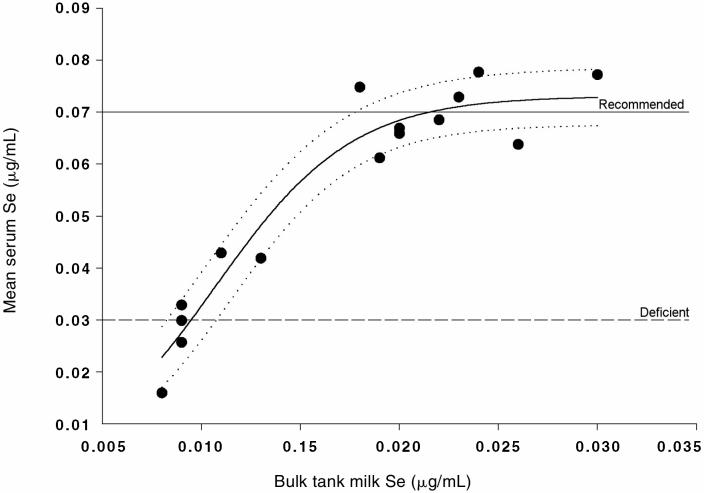
Figure 1.
The relationship between mean herd serum selenium (Se) concentration and the bulk tank milk Se concentration obtained from the same herd (n = 15 herds). The regression line is shown with upper and lower 95% confidence intervals. The regression line is given by the equation serum Se = 0.071/(1 +exp(-(BTMilkSe-0.0107)/0.0035)); adjusted R2 = 0.92, P <0.0001.

