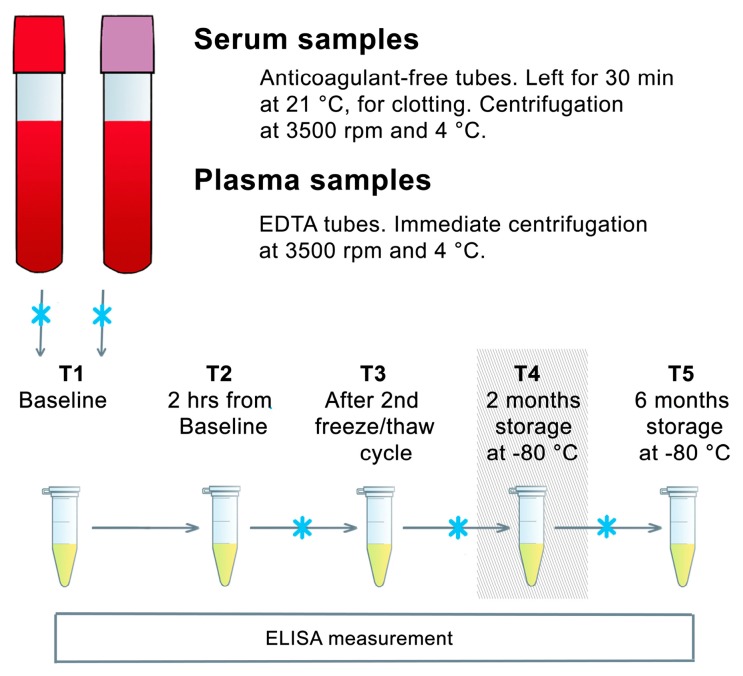
Figure 1.
Schematic design of the stability study. T1 to T5 represent time points for BDNF measurements. Blue crosses signify freezing at −80 °C. The grey box at T4 indicates the time point which was excluded from the analysis due to a measurement error. BDNF: brain-derived neurotrophic factor, EDTA: ethylenediaminetetraacetic acid, ELISA: enzyme-linked immunosorbent assay, hrs: hours, min: minutes, rpm: rounds per minute, T: time point.

