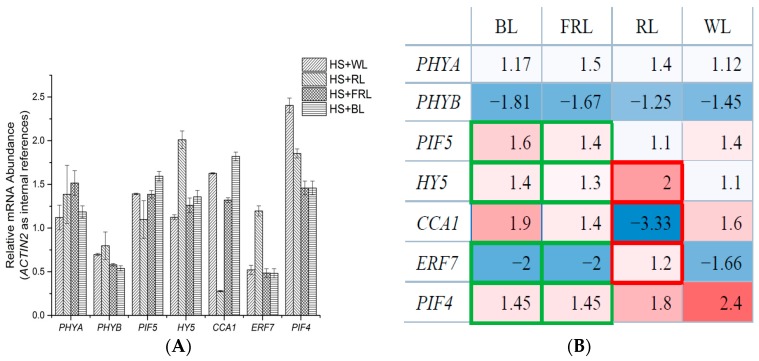
Figure 3.
Transcriptomic response to HS, under different light conditions treatment (compared to control plants, ACTIN2 used as internal references). Plants grown at 23 °C are chosen as control. mRNA extraction and qPCR experiments are conducted as described in the method. HS + WL: Plants in this group are treated at 37 °C for 30 min, under white light. HS + RL: Treated at 37 °C for 30 min, under red light. HS + FRL: Treated at 37 °C for 30 min, under far-red light. HS + BL: Treated at 37 °C for 30 min, under blue light. WL, white light; RL, red light; FRL, far-red light; BL, blue light. The histogram (A) shows the expressions of genes in different light conditions; the table (B) demonstrated the similarity between BL and FRL groups (green frames), and the particularity of RL group (red frames). Blue shadow means the gene expression was repressed by HS. Red shadow means enhanced.

