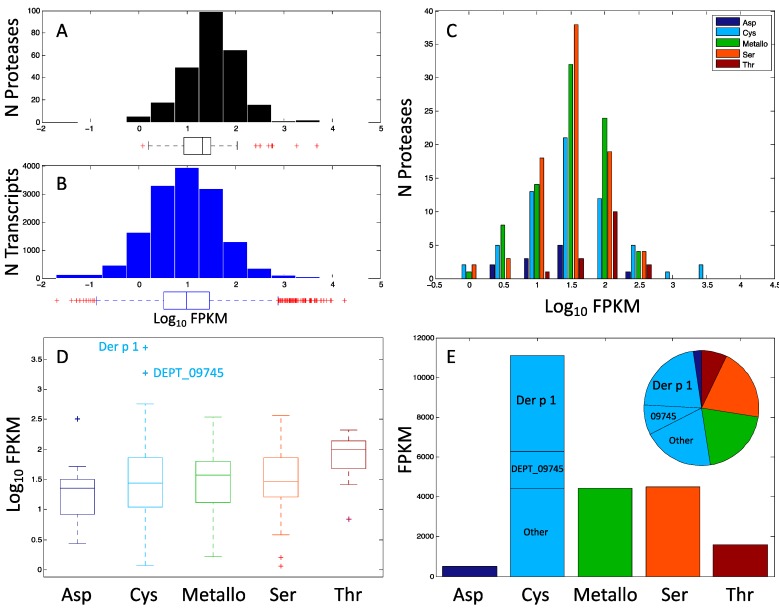
Figure 2.
Statistical analyses of protease expression in D. pteronyssinus. (A) Histogram and boxplot of log10 fragments per kilobase per million reads (FPKM) (relative expression) of proteases in DP (plus signs indicate outliers from the quartile analysis); (B) Histogram and boxplot of log10 FPKM of all transcripts in DP; (C) Histogram of protease relative expression subdivided by protease type; (D) Boxplot of protease relative expression subdivided by type; and (E) Bar graph and inset pie chart of FPKM relative expression (not scaled by log10) colored according to protease type with scaled insets for Der p 1 and DEPT_09745.

