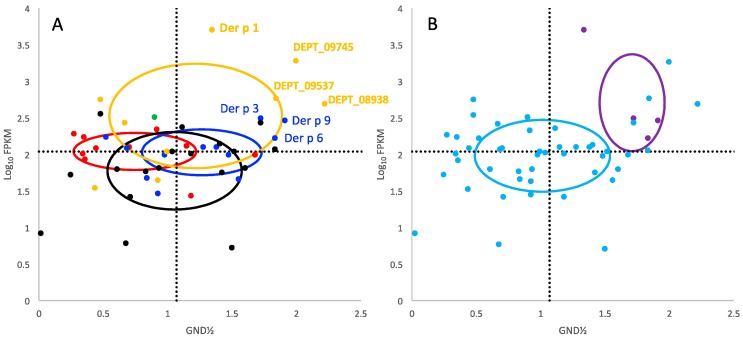
Figure 4.
Stability and expression of DP proteases. Panels (A,B) are the same stability and expression data grouped differently. The colors in (A) refer to: green, aspartyl; yellow, cysteine; black, metallo; blue, serine; red, threonine proteases. The colors in (B) refer to: light blue, non-allergens, and purple, allergens. Dotted lines are the mean for the axis measurement of all proteases; x, GND½; y, log10 FPKM. Ellipses are centered at the mean in x and y of each group and the radii are determined by the standard deviations in x and y of each group.

