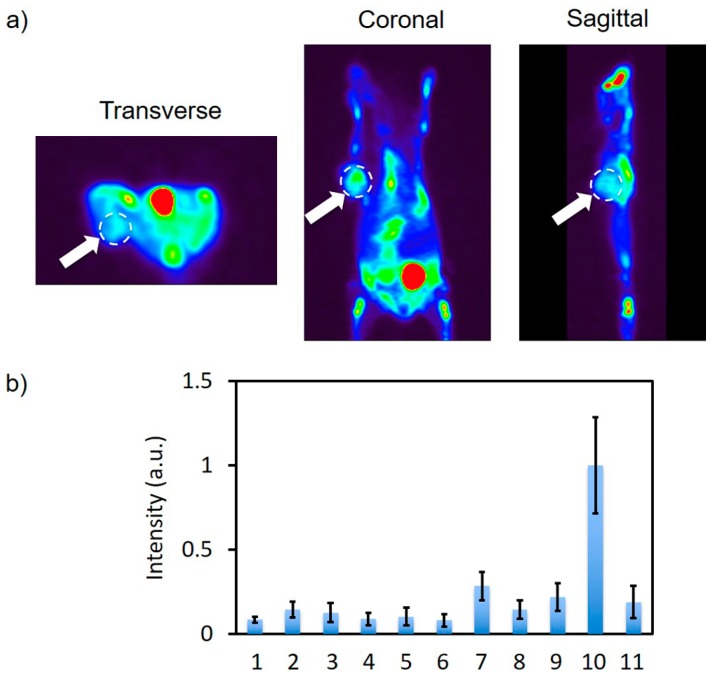
Figure 8.
(a) Tomographic PET imaging of a flank A549 tumor 6 h after intravenously injecting the Cy5-BF3 (18F). The white dashed circles indicate the tumor; the brightest spot (red) is the bladder, indicating renal clearance of the probe (b) the quantitative biodistribution by gamma counter (Wallac Wizard 3.0, %ID normalized to tumor) 6 h after intravenously injecting Cy5-BF3 (18F). The data are normalized on the tumor. 1—Heart, 2—Liver, 3—Spleen, 4—Lung, 5—Kidney, 6—Stomach, 7—Intestine, 8—Bone, 9—Muscle, 10—Tumor, 11—Brain.

