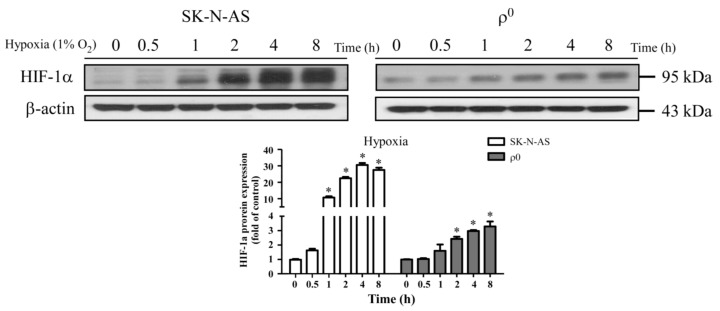
Figure 1.
Hypoxia induced factor 1α (HIF-1α) was activated in hypoxic SK-N-AS and ρ0 cells. The upper panel shows HIF-1α protein expression with immunoblotting after different hypoxic times in SK-N-AS and ρ0 cells; the bar chart below illustrates HIF-1α protein expression change with different hypoxic times (relative quantification to β-actin). Data are shown as mean ± SD of three independent experiments. * Represented p < 0.05 when compared to normoxic condition was determined using one-way ANOVA.

