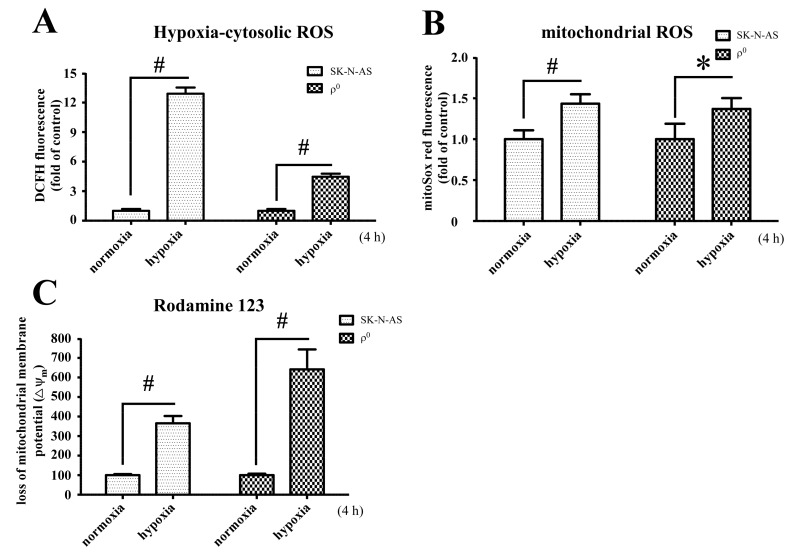
Figure 2.
Hypoxia and mitochondrial DNA (mtDNA) affect the production of ROS and loss of mitochondrial membrane potential (Δψm). Intracellular H2O2 production (A); or mitochondrial superoxide (B) under normoxia or after hypoxia for 4 h were determined by flow cytometry with DCFH-DA or MitoSox red individually in both SK-N-AS and ρ0 cells; (C) Loss of mitochondrial membrane potential in normoxic or hypoxic SK-N-AS and ρ0 cells were measured by Rodamine 123. The percentages loss of Δψm indicated the number of Δψm collapsed cells after exposure to hypoxia. These results are shown as mean ± SD of more than three independent experiments. Statistical significance (* p < 0.05, # p < 0.005) was determined using the one-way ANOVA compared to normoxia.

