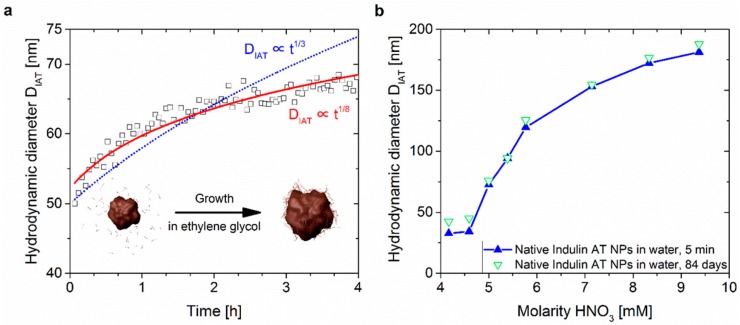
Figure 6.
(a) Growth kinetics after the initial pH drop with a final HNO3 concentration of 5 mM; (b) Hydrodynamic diameter versus final concentration of HNO3 after the pH drop. Reprinted with permission from Richter et al. [43]. Copyright 2016 American Chemical Society.

