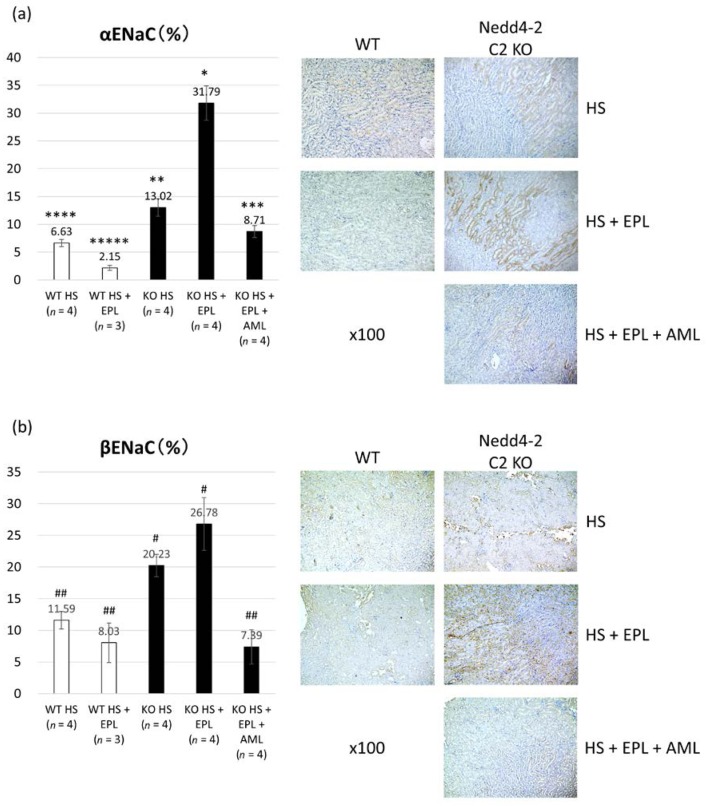
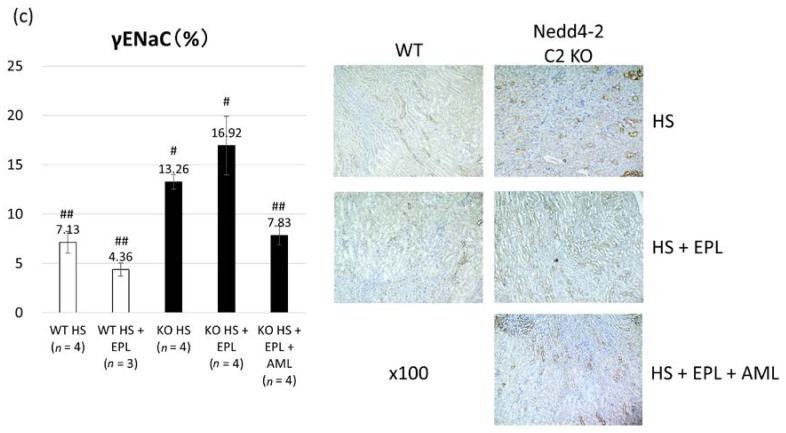
Figure 5.
Immunostaining of (a) α ENaC; (b) β ENaC; and (c) γ ENaC proteins by immunohistochemistry. Data are from wild-type mice on a high-salt diet (n = 4), wild-type mice on a high-salt plus EPL diet (n = 3), Nedd4-2 C2 KO mice on a high-salt diet (n = 4), and Nedd4-2 C2 KO mice on a high-salt plus EPL diet (n = 4). * p < 0.01 compared with WT HS, WT HS + EPL, KO HS, and KO HS + EPL + AML; ** p < 0.05 compared with WT HS, WT HS + EPL, and KO HS + EPL; *** p < 0.05 compared with WT HS + EPL and KO HS + EPL; **** p < 0.05 compared with WT HS + EPL, KO HS, and KO HS + EPL; ***** p < 0.05 compared with WT HS, KO HS, KO HS + EPL, and KO HS + EPL + AML. # p < 0.01 compared with WT HS, WT HS + EPL, and KO HS + EPL + AML; ## p < 0.01 compared KO HS and KO HS + EPL.


