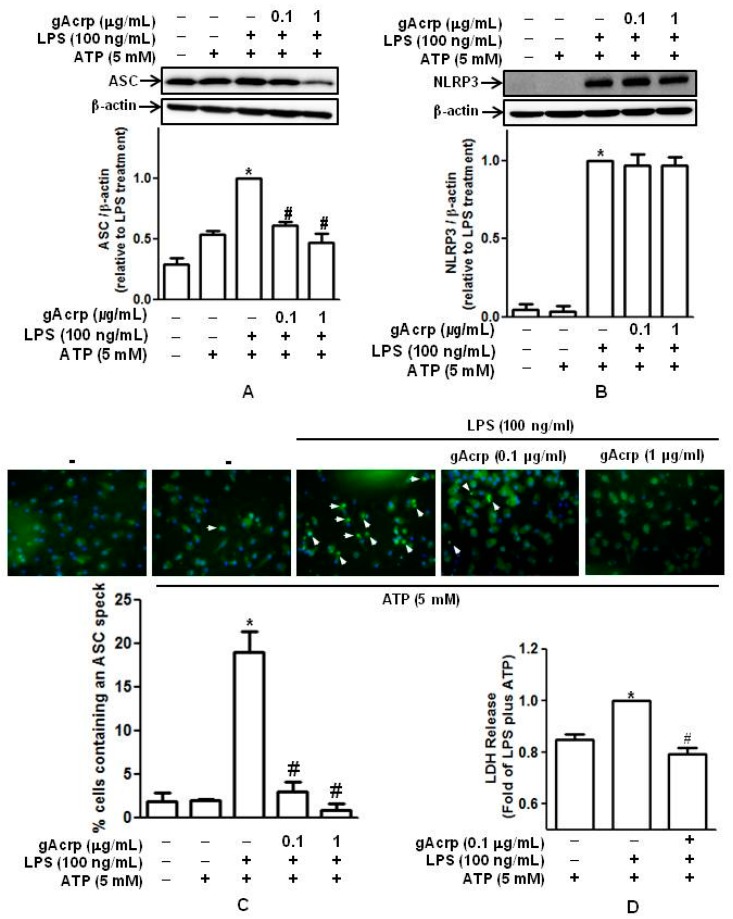
Figure 3.
Effects of globular adiponectin on the inflammasome activation and lactate dehydrogenase (LDH) release in murine peritoneal macrophages treated with lipopolysaccharide (LPS). Peritoneal macrophages were pretreated with gAcrp (0.1 μg/mL) for 18 h, stimulated with LPS (100 ng/mL) for 6 h, and then treated with ATP (5 mM) for 1 h. (A) ASC expression levels were determined by Western blot analysis. Representative images from three independent experiments are shown along with β-actin as an internal loading control; (B) NLRP3 expression levels were determined by Western blot analysis. Representative images from three independent experiments are shown along with β-actin as an internal loading control. Quantitative analyses for the measurement of ASC (A) and NLRP3 (B) expression were performed by densitometric analysis and shown in the lower panel. Values presented are fold change compared to LPS and ATP treatment and expressed as mean ± SEM (n = 3). * p < 0.05 compared to the control cells. # p < 0.05 compared to the cells treated with LPS and ATP; (C) cells were stained with a specific antibody against ASC (green) and DAPI (blue). ASC speck formation was analyzed by fluorescent immunocytochemistry and is indicated by white arrows. Representative images from three independent experiments are presented. Quantitative analysis of ASC speck formation (dots) was performed by counting the cells that showing ASC-DAPI and shown in the lower panel. Values are expressed as a percentage of the cells that showing ASC-DAPI dots. * p < 0.05 compared to cells treated with ATP; # p < 0.05 compared to cells treated with LPS and ATP; (D) cell culture media were collected and used to measure LDH release. Values are shown as the mean ± SEM, n = 3. * p < 0.05 compared with cells treated with ATP; # p < 0.05 compared with cells treated with LPS and ATP.

