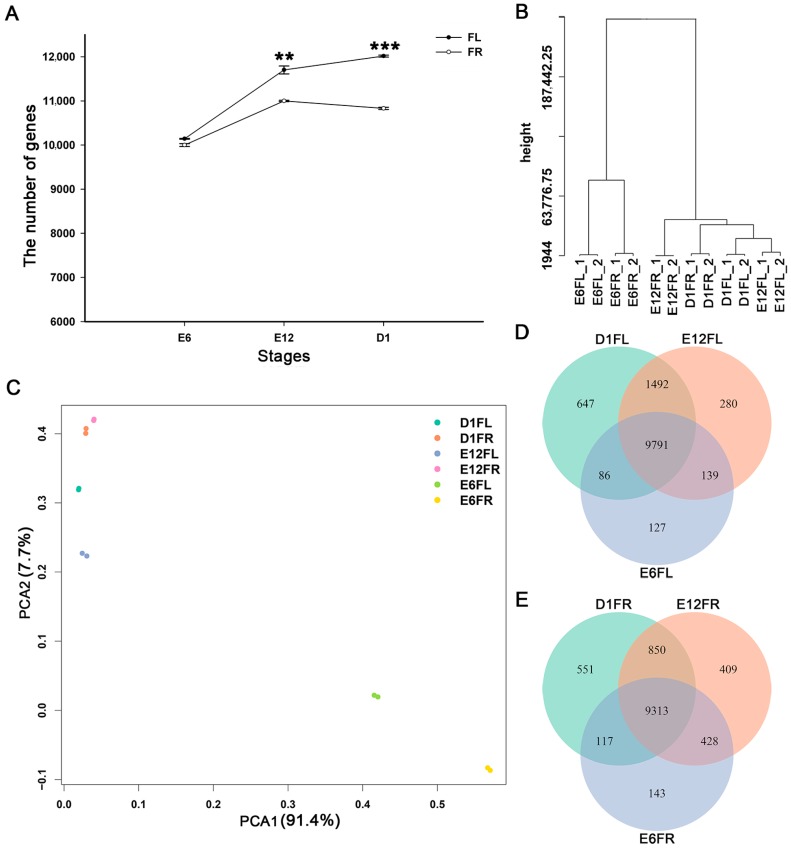
Figure 1.
Analysis of global gene expression among different samples. (A) Number of genes expressed in the left and right gonad. Statistically significant differences in the number of genes in the left and right gonad were analyzed by Student’s t-test; ** p < 0.01, *** p < 0.001 (L: Left, R: Right); (B) Hierarchical clustering of all the biological samples; (C) The principal component analysis (PCA) of the RNA-seq data for all the biological samples. Venn diagrams indicate the overlap of global gene expression signatures identified at stages E6, E12, and D1 of the female left gonad (D) and right gonad (E). E6FL Female left gonad on E6, E12FL Female left gonad on E12, D1FL Female left gonad on D1, E6FR Female right gonad on E6, E12FR Female right gonad on E12, and D1FR Female right gonad on D1.

