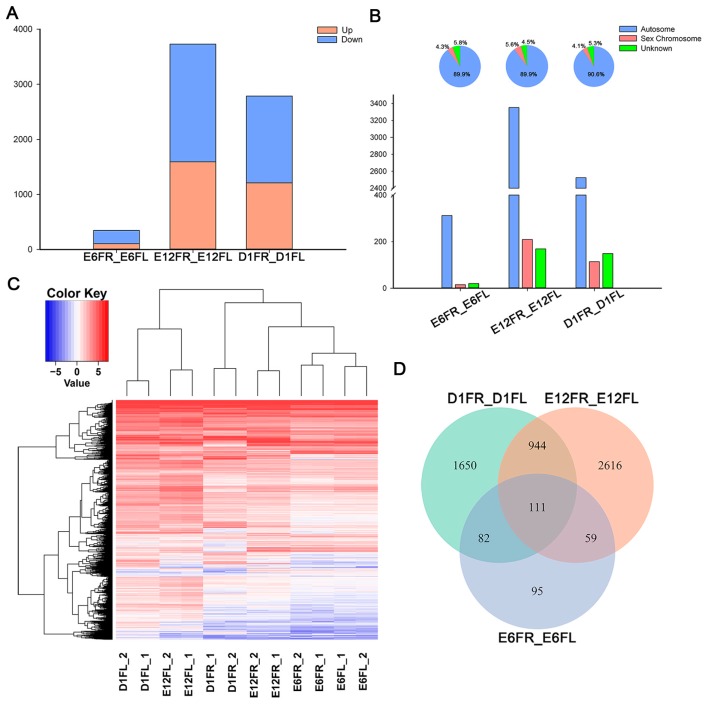
Figure 2.
Analysis of differently expressed genes (DEGs) between the left and right gonads. (A) Number of DEGs between the left and right gonads; (B) Chromosomal allocation of DEGs in the left and right gonads; (C) Hierarchical clustering of DEGs in all of the biological samples. Each row represents a gene and each column represents a sample. Each cell in the matrix corresponds to an expression level, with blue for under-expression, red for overexpression, white for gene expression close to the median (see color scale). (D) Venn diagrams show the shared and unique DEGs obtained from each pairwise comparison between the left and right gonads. E6FR_E6FL, E6FR vs. E6FL; E12FR_E12FL, E12FR vs. E12FL; D1FR_D1FL, D1FR vs. D1FL.

