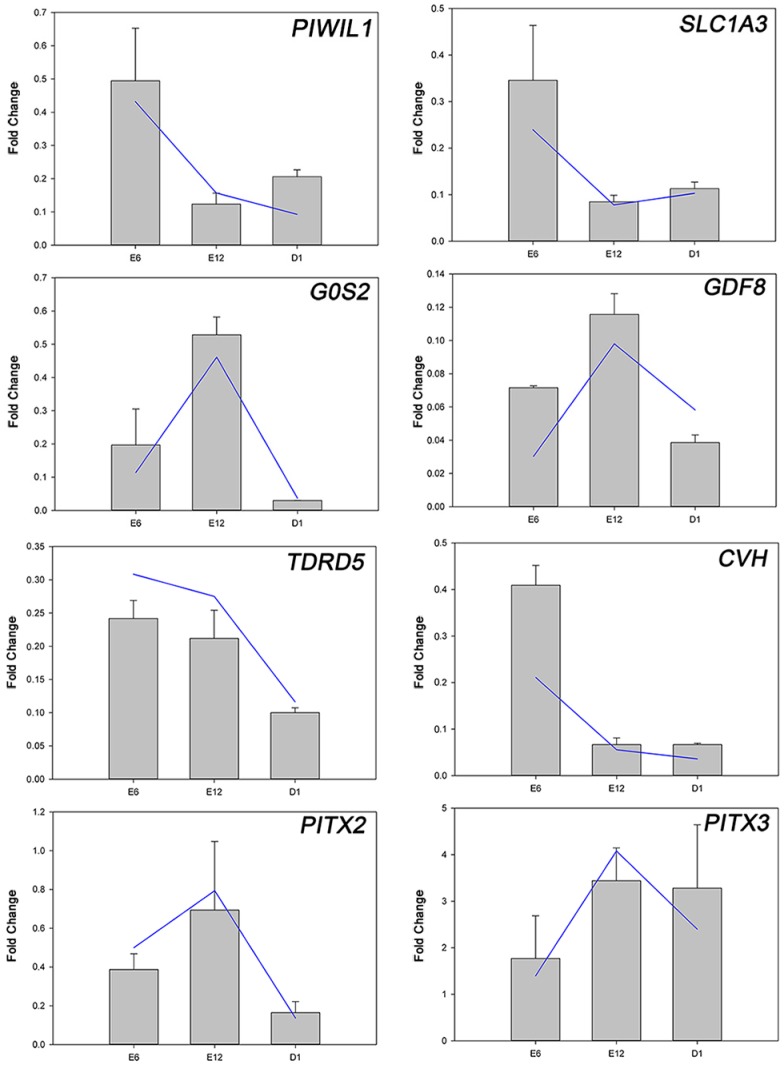
Figure 3.
Expression patterns of eight DEGs involved in left-right asymmetry by RNA-seq (blue line) and qRT-PCR (gray bar). The quantitative real-time RT-PCR (qRT-PCR) values were normalized relative to the expression levels of GAPDH in the same cDNA sample. Expression data are presented as the expression values of genes in the right gonads relative to that in the left sample. Data are expressed as the mean ± SD of two biological replicates.

