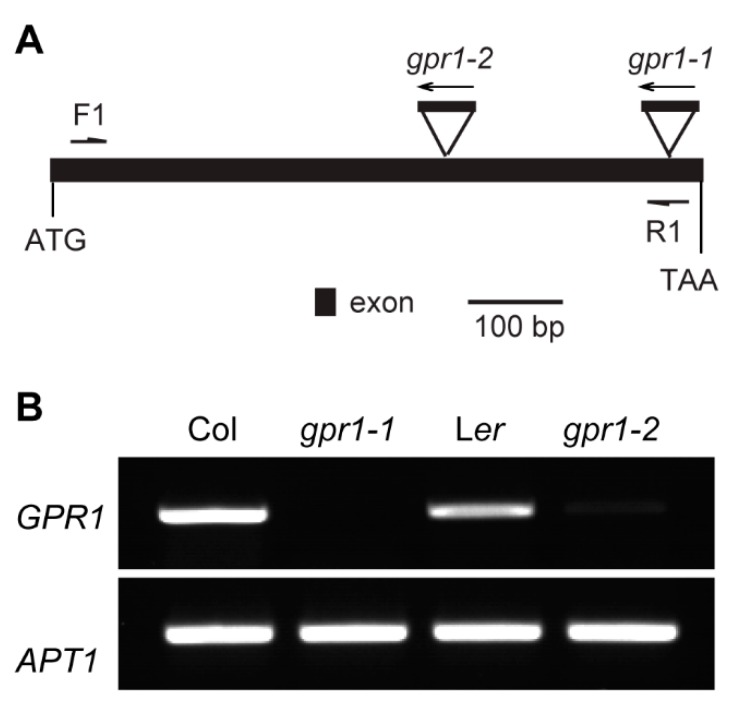
Figure 5.
Isolation of gpr1 mutant. (A) Schematic diagram of T-DNA or Ds insertion sites in gpr1 mutants. Dark box indicates exon; triangles indicate T-DNA or Ds insertion sites. (B) Reverse transcription (RT)-PCR analysis of the expression levels of GPR1 in wild-type, gpr1-1, and gpr1-2 flower buds. APT1 was used as the internal control.

