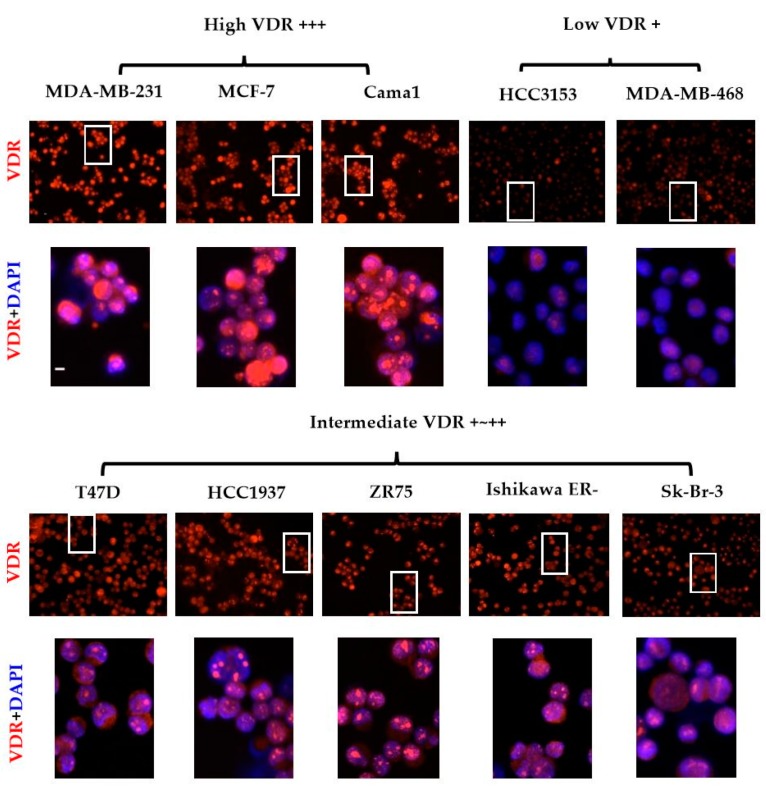
Figure 3.
VDR expression in nine BC and one endometrial cell lines. Fluorescence labeling of VDR (in red), CK with DAPI (in blue) nuclear staining was performed on 106 cells from 10 cell lines. Various levels of VDR expression were observed, including low (+), average (+~++), or high (+++) levels. Photographs presented are representative of five independent reproducible experiments. Original magnification, ×40. Scale bar (white bar in the upper left image), 10 μm. BC: breast cancer.

