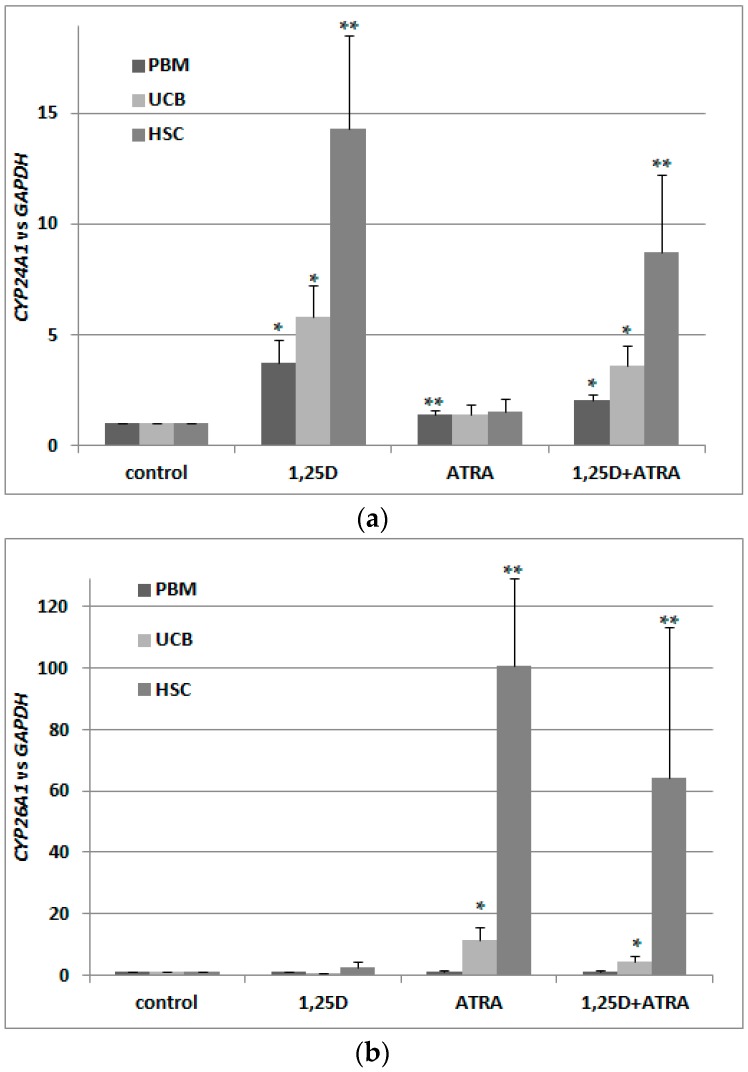
Figure 3.
Transcriptional activity of VDR (a) and RARs (b) in human blood cells. Human blood cells were isolated as described in Materials and Methods. The cells were exposed ex vivo to 10 nM 1,25D ± 1 μM ATRA for 96 h. Then mRNA was isolated and CYP24A1 (a) or CYP26A1 (b) expression was measured by Real-time PCR. The bars represent mean values (±SEM) of the fold changes in mRNA levels relative to GAPDH mRNA levels. Values that are significantly higher than from these obtained for respective control are marked with asterisks (* p < 0.01, ** p < 0.05).

