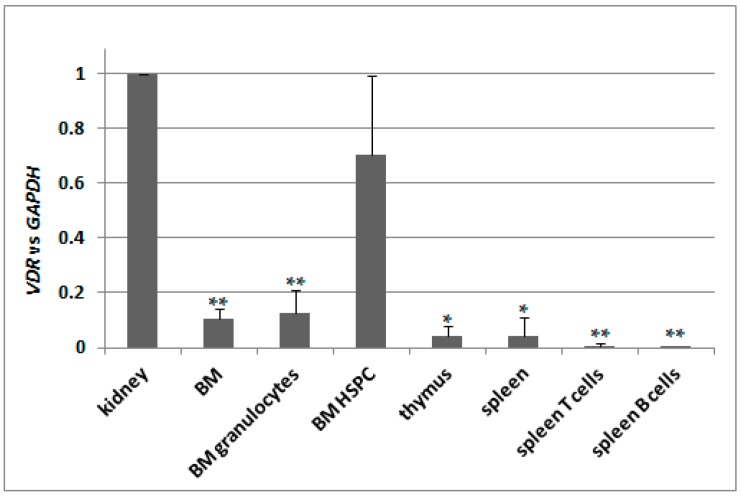
Figure 5.
Expression of VDR in C57BL/6 mice. Tissues from 2 to 9 mice were isolated as described in Materials and Methods. mRNA was isolated and VDR expression was measured by Real-time PCR. The bars represent mean values (±SEM) of the fold changes in mRNA levels relative to GAPDH mRNA levels. Values that are significantly different from these obtained for kidney are marked with asterisks (* p < 0.01, ** p < 0.05).

