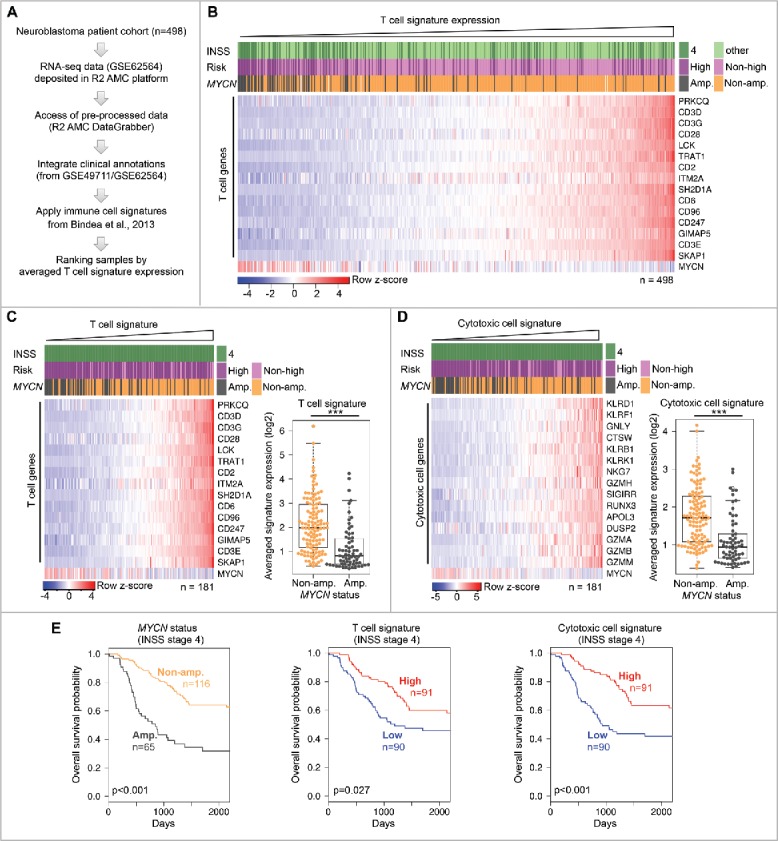
Figure 1.

Genomic MYCN amplification is associated with a T-cell-poor microenvironment in metastatic neuroblastoma. (A) Outline of analysis. (B) Expression of T-cell signature genes in entire neuroblastoma cohort. Samples ranked by increasing T-cell signature expression. Log2 gene expression values were z-score transformed for heatmap visualization. Clinical and genomic annotations are indicated. (C) Left panel: The same analysis as in (B), but restricted to INSS stage 4 neuroblastomas. Right panel: T-cell signature expression in MYCN-amplified and non-MYCN-amplified metastatic neuroblastomas. ***p < 0.001; two-sided Wilcoxon rank test. MYCN-amp., n = 65; non-MYCN-amp., n = 116. (D) The same analysis as in (C), but using the cytotoxic immune cell signature. (E) Kaplan–Meier survival plots of INSS stage 4 neuroblastomas stratified by MYCN amplification status (left panel), T-cell signature expression (middle panel) and cytotoxic immune cell signature (right panel). High/low groups were defined by an unbiased median expression value cut-off. p-values determined by two-sided log-rank test.
