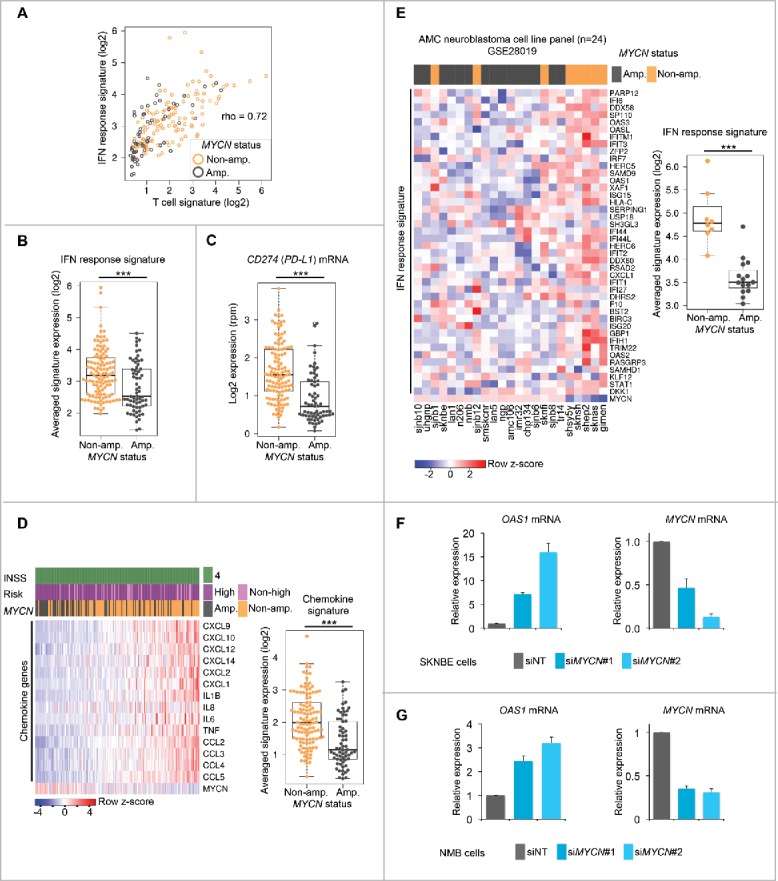
Figure 3.

MYCN amplification status is associated with a lower IFN pathway activity in primary metastatic neuroblastomas and cultured neuroblastoma cell lines. (A) Scatter correlation plot of IFN response versus T-cell signature expression in INSS stage 4 neuroblastomas. MYCN amplification status of individual samples is color-coded as indicated. rho; Spearman rank correlation value. (B) IFN response signature expression in MYCN-amplified versus non-MYCN-amplified metastatic neuroblastomas. ***p < 0.001; two-sided Wilcoxon rank test. MYCN-amp., n = 65; non-MYCN-amp., n = 116. (C) The same analysis as in (B), but log2-transformed reads per million (rpm) of CD274 (PD-L1) mRNA expression. (D) Left panel: Expression of selected cytokine and chemokine genes in INSS stage 4 neuroblastoma tissues. Samples ranked by increasing signature expression. Log2 gene expression values were z-score transformed for heatmap visualization. Clinical and genomic annotations as indicated. Right panel: Chemokine signature expression in MYCN-amplified versus non-MYCN-amplified metastatic neuroblastomas. ***p < 0.001; two-sided Wilcoxon rank test. MYCN-amp., n = 65; non-MYCN-amp., n = 116. (E) Left panel: Heatmap clustering of IFN response signature gene expression in human neuroblastoma cell lines. MYCN amplification status is indicated. Right panel: IFN response signature expression in MYCN-amplified versus non-MYCN-amplified human neuroblastoma cell lines. ***p < 0.001; two-sided Wilcoxon rank test. MYCN-amp., n = 16; non-MYCN-amp., n = 8. (F, G) qRT-PCR analysis of relative OAS1 and MYCN mRNA expression (normalized to UBC mRNA expression) in the MYCN-amplified human neuroblastoma cell lines SKNBE (F) and NMB (G) treated with siNT (non-targeting siRNA pool) or two independent siRNAs against MYCN. Error bars indicate standard deviations (s.d.) from three biologic replicates.
