
Figure 4.
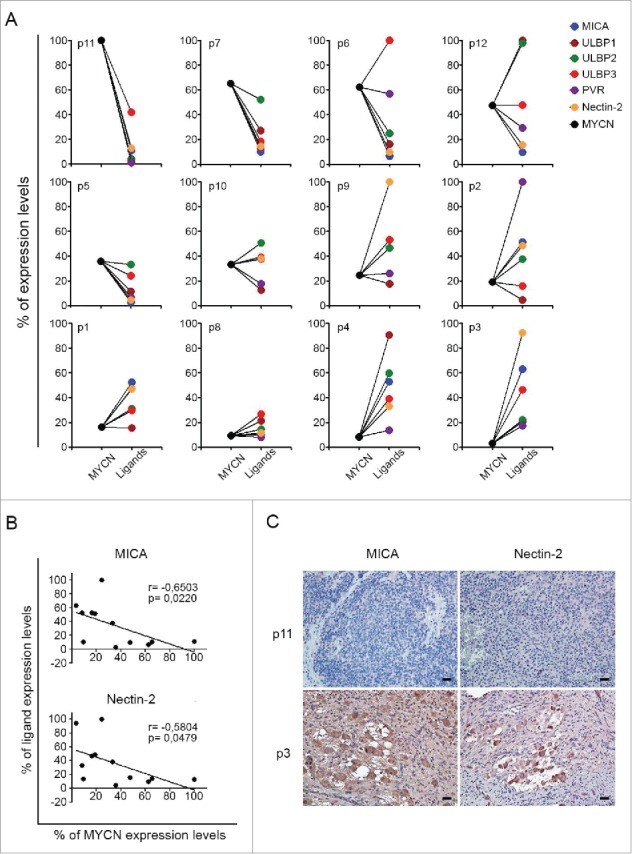
Expression of MYCN and of NK-cell-activating receptor ligands in primary NB cells. (A) qPCR analysis of MYCN and the indicated activating ligands in 12 primary NB samples. GAPDH was used for normalization. Data were normalized as percentages of the highest value obtained for each marker and plotted as percentage of expression levels. Data are representative of four experiments. (B) Scatter plots showing the correlation between MYCN and both MICA and Nectin-2 in 12 NB samples. The means of four independent qPCR analyses, expressed as percentage of expression levels, of MYCN are plotted against those of MICA and Nectin-2; Spearman correlation r and p value are shown for each plot. (C) Expression of MICA and Nectin-2 in primary NB samples by immunohistochemistry assay. MICA and Nectin-2 expressing cells are shown in brown. Nuclei are counterstained with hematoxylin (blue). Original magnification, ×20. Scale bars 30 µm.