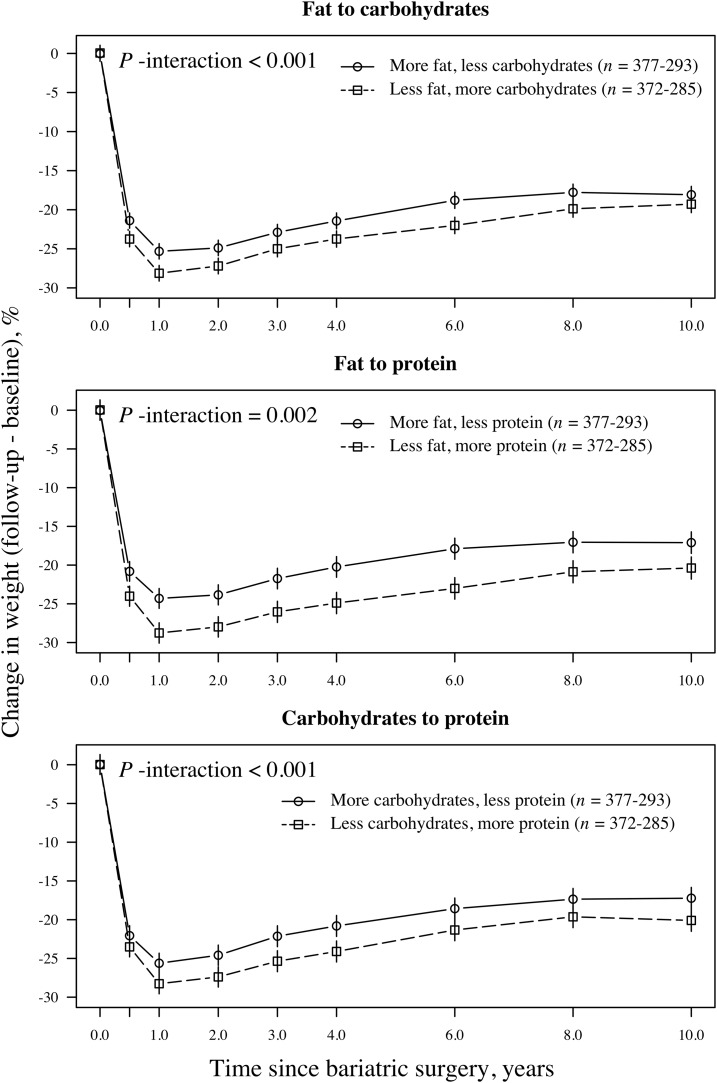
FIGURE 4.
Mean (95% CI) relative weight loss after bariatric surgery on the basis of a mixed model in women (n = 1130) grouped by isoenergetic changes in the proportions of carbohydrates, fat, and protein in the diet. The upper plot illustrates the relative weight loss over time in participants who favored carbohydrates over fat (squares with dashed lines) and in participants with the opposite composition (circles with solid lines). The middle plot illustrates the relative weight loss over time in participants who favored protein over fat (squares with dashed lines) and in participants with the opposite composition (circles with solid lines). In the lower plot, the relative weight loss over follow-up time is illustrated with participants grouped according to those who favored protein over carbohydrates (squares with dashed lines) and in those with the opposite composition (circles with solid lines). P-interaction values between the relative weight change over time and the change categories were derived from an ANOVA (F statistics).

