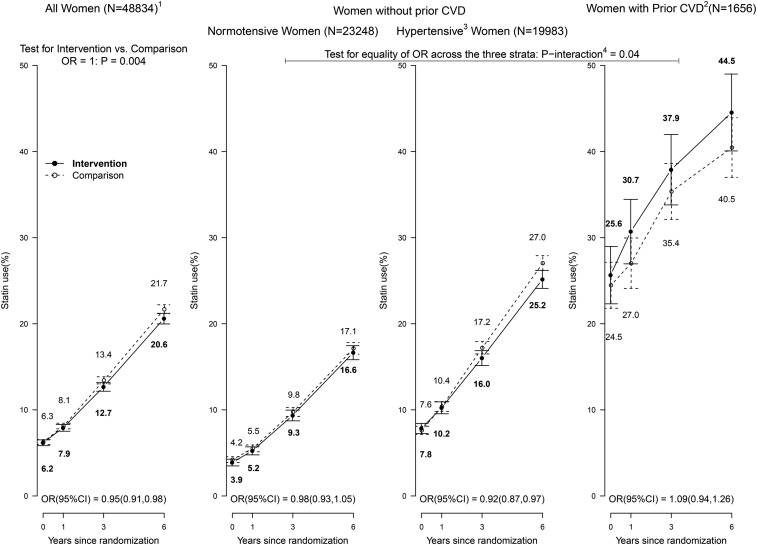
FIGURE 2.
Statin usage in the Dietary Modification Trial during the intervention period: overall, by baseline hypertension status among women without a history of CVD, and among women with a history of CVD. Summary statistics are shown for the overall cohort (all women randomly assigned; left panel), baseline hypertension subgroups among women without a history of CVD (middle panels), and women with a history of CVD (right panel) during the intervention period. Sample size indicates the number of participants with a baseline medication collection. To summarize statin usage during the 3 follow-up visits by randomization group (intervention or comparison), a mean OR (95% CI) was computed for all women and by subgroup through the use of generalized estimating equations with an unstructured correlation matrix. For the visual display, statin usage at each visit was computed as the percentage of women taking statins divided by the number of women with a medication collection; bow ties represent ∼95% confidence limits. 1Sample size of the overall cohort and baseline subgroups at randomization. 2Self-report of MI, CABG/PCI, or stroke before randomization; may also have baseline hypertension. 3Self-report of ever taking antihypertensive medication before randomization, or clinic-measured systolic/diastolic blood pressure ≥140/90 mm Hg; excludes women with missing baseline hypertension status data. 4P-interaction corresponds to a 2-df test for the interaction between OR and baseline hypertension or prior CVD strata. CABG/PCI, coronary artery bypass graft/percutaneous coronary intervention; CVD, cardiovascular disease; MI, myocardial infarction.

