Figure 5.
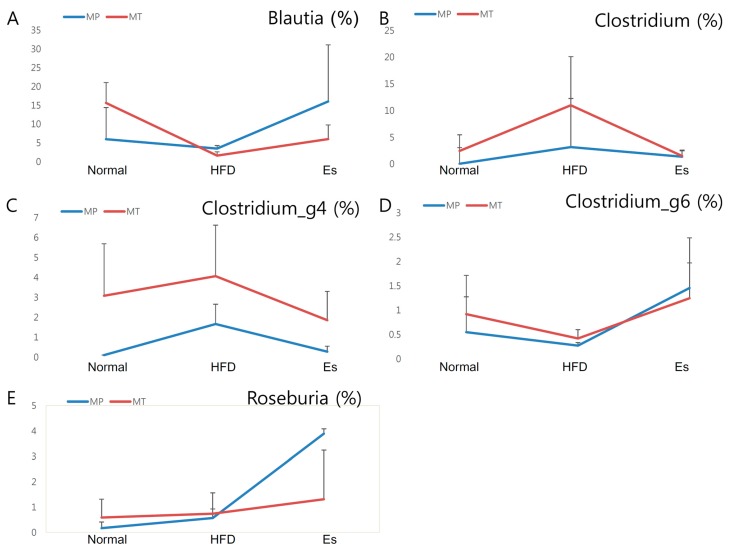
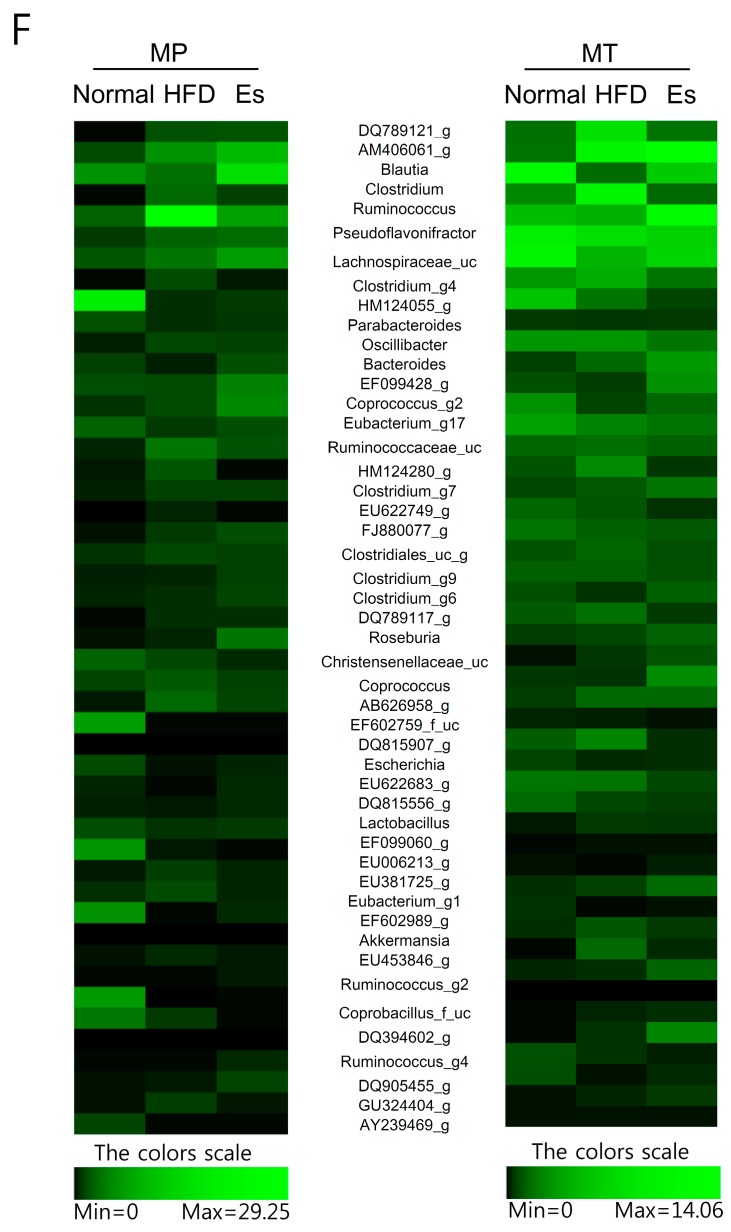
Comparison of genus level of gut microbiota At least more than 0.5% of genus of gut microbiota in any group were selected according to the pyrosequencing data. The variation tendency of several representative genera, like Blautia (A); Clostridium (B); Clostridium_g4 (C); Clostridium_g6 (D) and Roseburia (E), showed a conformity pattern between MP and MT experiment; (F) At least more than 1% of genus in any group were selected and compared using heatmap. The visualized heatmap were figured by PermutMatrix (Version 1.9.3 EN). As the colors scale shown, green color indicates a higher proportion, while black color shows a lower proportion.


