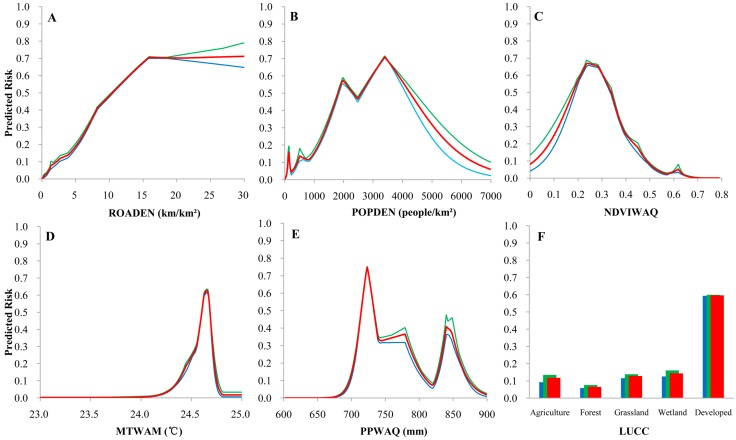
Figure 4.
Response curves for the variables in model C as related to the predicted risk of Dengue Fever outbreak. Red line/bar indicates the mean values for the 10 Maxent runs; green line/bar indicates the maximum values; and blue line/bar indicates the minimum value. (A) road density; (B) population density; (C) normalized difference vegetation index (NDVI) of the warmest quarter; (D) mean temperature of the warmest month; (E) precipitation of the warmest quarter; (F) land use and land cover change (LUCC).

