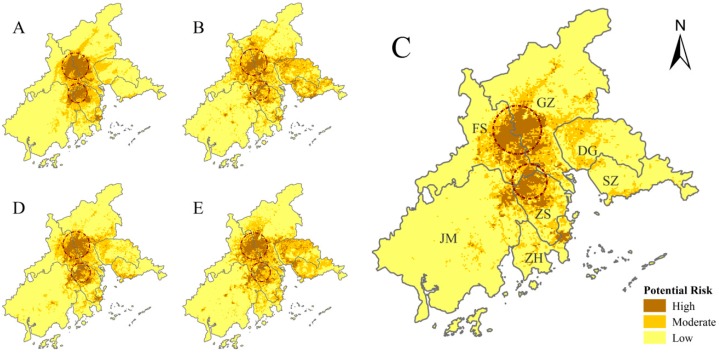
Figure 5.
Areas of Dengue Fever outbreak risk, as calculated by the different models (where the letters A–E relate to the aggregated results from each model). Model definitions are found in Table 3. Model C is the model that we believe best fits the data. Dotted circles indicate areas at highest risk, as chosen by all models.

