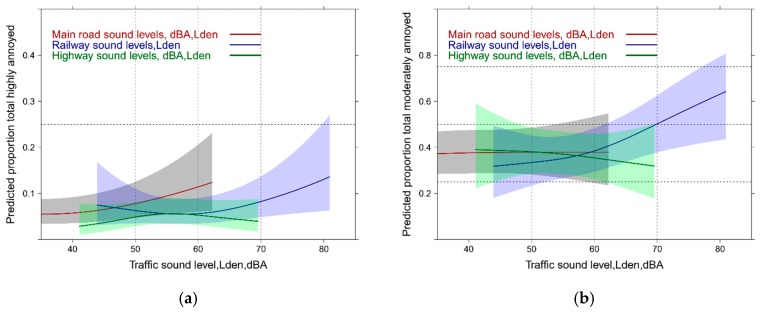
Figure 17.
Predicted proportion of total annoyance associated with sound from all sources. (a) Proportion highly annoyed; (b) Proportion moderately annoyed. Models are adjusted for age, gender, education, health status, complaints about community soundscape and air pollution, perceived vibration, perceived dust/soot from road, coping, anger at traffic load and the respective other sound sources.

