Figure 1.
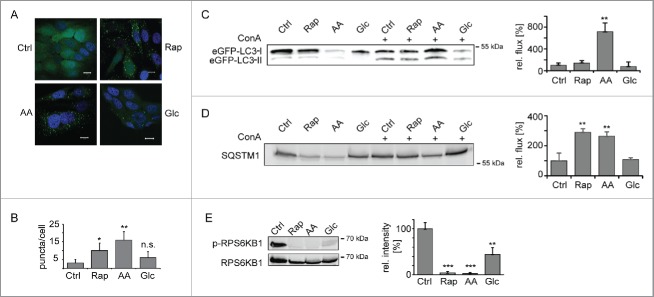
Induction of macroautophagy. (A) Accumulation of autophagosomes. MCF7-eGFP-LC3B cells were left untreated, AA, Glc starved, or treated with Rap (100 nM) for 24 h. Stimulus-dependent accumulation of autophagosomes was visualized by translocation of eGFP-LC3B into dotted structures. Nuclei were stained with DAPI. Scale bar: 10 µm. (B) Quantification of autophagosomes. Autophagosomes were counted in a minimum of 50 cells as shown in (A). Average autophagosome numbers ± SD are depicted. (C) Macroautophagic flux analysis using eGFP-LC3B-II. Cells were treated as in (A) and, in addition, ConA (2 nM) was added as indicated. Samples were normalized to cell number and eGFP-LC3B-II bands of ConA-treated samples were analyzed relative to respective untreated samples by western blot. Right panel depicts quantification (n = 3). (D) Macroautophagic flux analysis using SQSTM1. Samples were treated and analyzed as in (C). (E) Inhibition of MTOR. Phosphorylation levels of RPS6KB1 were monitored using a Thr389 phosphosite-specifc antibody (upper lane). Lower lane shows loading control. Right panel depicts quantification (n = 3). *: p < 0.05; **: p < 0.01; ***: p < 0.001, unpaired T test.

