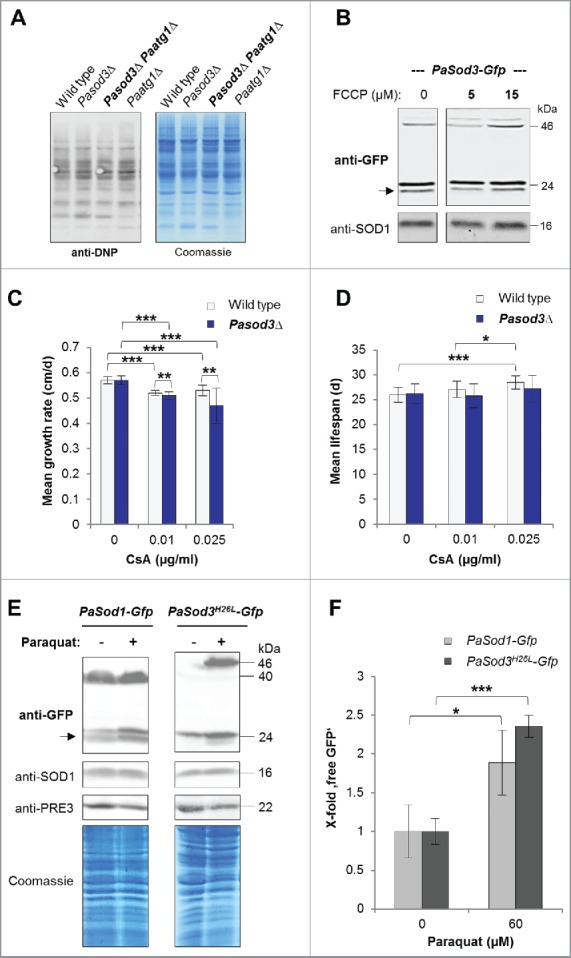
Figure 6.

Influence of oxidized proteins, membrane potential, mPTP and oxidative stress on mitophagy induction in Pasod3Δ. (A) ‘Oxy blot’ analysis of total protein extracts from wild type, Pasod3Δ, Pasod3Δ Paatg1Δ and Paatg1Δ (n = 3) Carbonyl groups of oxidized proteins derivatized to 2,4-dinitrophenylhydrazone (DNP-hydrazone) were detected with a DNP-specific antibody. The Coomassie Blue-stained gel after blotting served as a loading control. (B) Monitoring mitophagy during FCCP treatment (0, 5 and 15 µM) via western blot of PaSod3-Gfp. (C) Growth rates of wild type (n = 10) and Pasod3Δ (n = 11) treated with 0, 0.01 and 0.025 µg/ml cyclosporine A (CsA). Error bars correspond to the standard deviation. P values were determined between wild type and Pasod3Δ (2-tailed Mann-Whitney-Wilcoxon U test). (D) Life span of monokaryotic wild type (n = 10) and Pasod3Δ (n = 11) treated with 0, 0.01 and 0.025 µg/ml CsA. (E) Monitoring autophagy and mitophagy during paraquat treatment (60 µM) via western blot analysis of PaSod1-Gfp and PaSod3H26L-Gfp. (F) GFP protein levels of PaSod1-Gfp and PaSod3H26L-Gfp (n = 4) untreated (0 µM, set to 1) and treated (60 µM) with paraquat were normalized to the amount of proteins on the Coomassie Blue-stained gel. P values were determined between paraquat-untreated and treated cultures of each strain.
