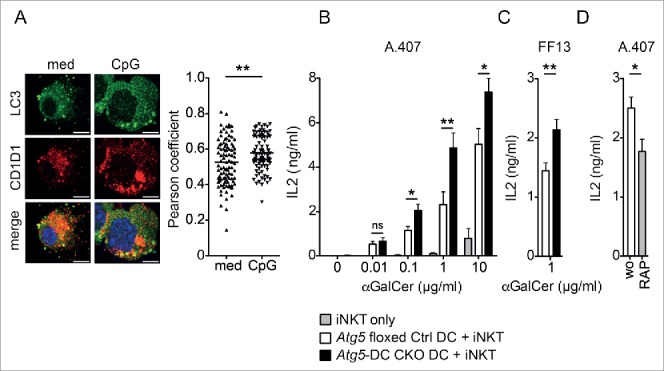
Figure 1.

Loss of Atg5 increases the iNKT cell stimulatory capacity of dendritic cells. C57BL/6 derived splenic DCs were either incubated with 2 µg/ml CpG or left untreated. Original magnification with 63×, 1.4 NA oil immersion lens. Scatter dot plot representation and quantification of colocalization between CD1D1 and LC3A (Pearson coefficient analysis). Each symbol represents one cell. Pooled data of 3 independent experiments are shown. Scale bar: 2.5 µm. Statistics: 2-tailed Mann-Whitney U Test (A). FAC-sorted ITGAX and I-Ab double-positive splenic DCs derived from Atg5 floxed Ctrl or Atg5-DC CKO animals were pulsed with increasing concentrations of αGalCer or left untreated and subsequently cocultured with the iNKT hybridoma cell line A.407 (B) or FF13 (C) for 24 h. IL2 concentration in cell culture supernatants was measured via ELISA. Pooled data and SEM of > 3 independent experiments are shown. Each experiment contained at least 3 animals per group. Statistics: 2-tailed unpaired Student t test. C57BL/6 derived purified splenic DCs were treated with rapamycin (RAP; 12.5 μM; 4 h), subsequently pulsed with αGalCer (1 µg/ml; 4 h) and cocultured with iNKT hybridoma cell line A.407 (24 h). IL2 concentration in cell culture supernatants was measured via ELISA. Pooled data and SEM of 3 independent experiments is shown. Each experiment contained at least 3 animals per group. Statistics: 2-tailed unpaired Student t test (D). *** P ≤ 0.001,** P ≤ 0.01,* ≤ 0.05, ns P > 0.05.
