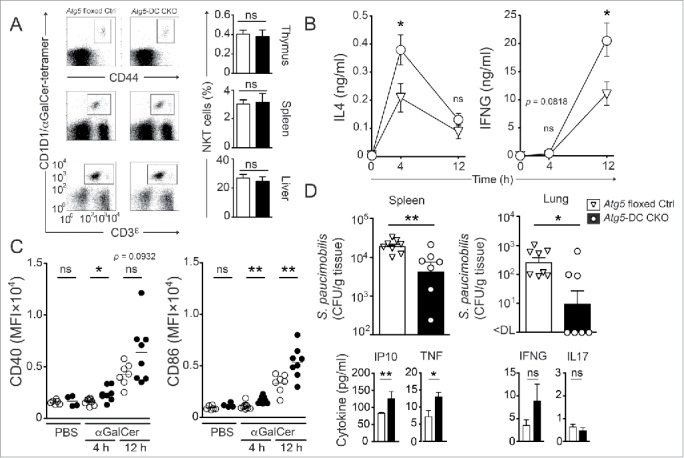
Figure 5.

Autophagy proteins in DCs regulate iNKT cell responses to lipid immunization and microbial infection in vivo. Frequencies of iNKT cells (thymus, spleen and liver) from naïve Atg5 floxed Ctrl and Atg5-DC CKO mice were quantified. Representative dot plots from at least 2 independent experiments are shown (A). Serum concentration kinetics of IL4 and IFNG upon glycolipid challenge in vivo measured via ELISA (B). Surface expression kinetics of CD86 and CD40 on splenic DCs. Each symbol represents one animal. Pooled data of at least 2 independent experiments are shown. Statistics: 2-tailed unpaired Student t test (C). Quantification of bacterial titers (CFU/g tissue) in spleen and lung after in vivo infection of mice with S. paucimobilis. Each symbol represents one animal. One representative of 2 experiments with similar results is shown. Quantification of serum cytokines upon in vivo infection with S. paucimobilis. One representative of 2 experiments with similar results is shown. Statistics: 2-tailed Mann-Whitney U Test (D). *** P≤ 0.001,** P≤ 0.01,* ≤ 0.05, ns P> 0.05. MFI, mean fluorescence intensity.
