
Figure 4.
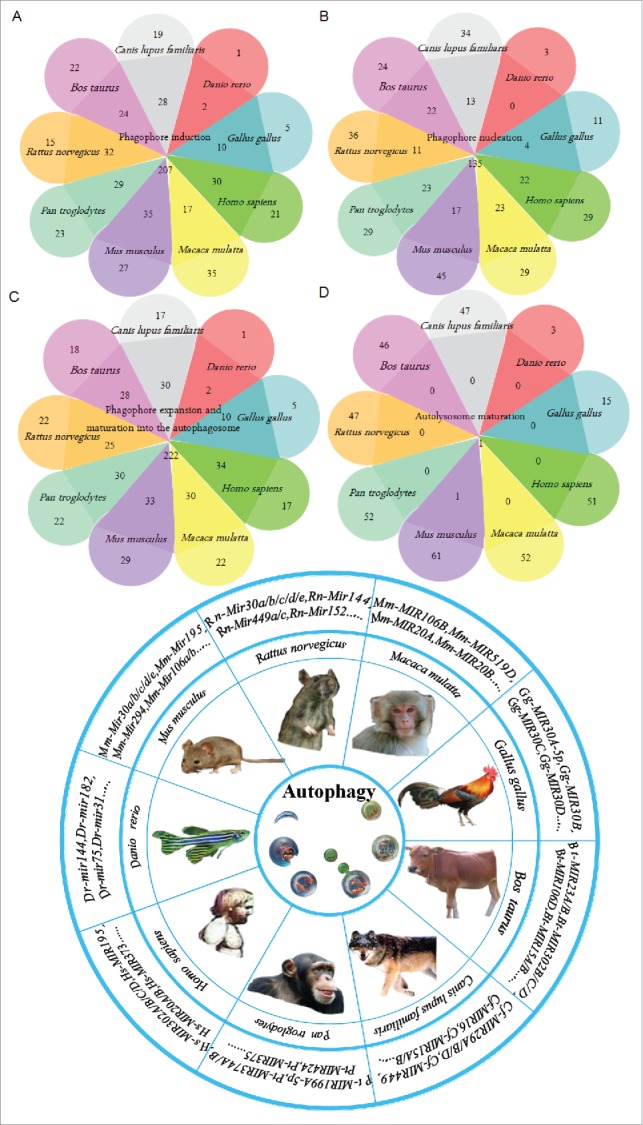
An overview of the functional and physical interactions between multiple predicted miRNAs from different species and autophagy. The Venn diagram includes 375 predicted miRNAs in the analysis. According to species, we assigned the miRNAs to 9 groups during the different steps of autophagy, and the data intersection is shown in the Venn diagram. The pie chart presents the different species involved in this biological miRNA prediction and the representative predicted miRNAs that are involved in autophagy.