
Figure 1. An NK/T cell, EOMES-associated gene signature was detected in whole blood of teplizumab R subjects.
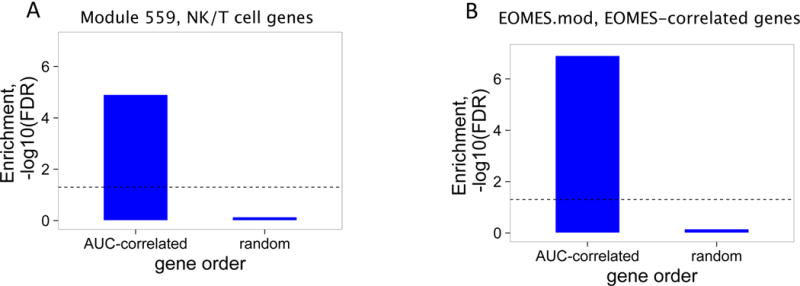
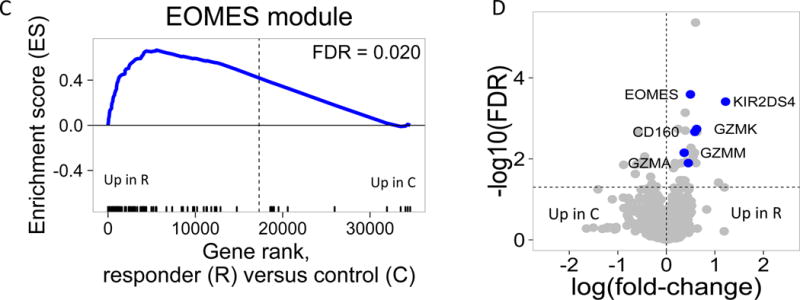
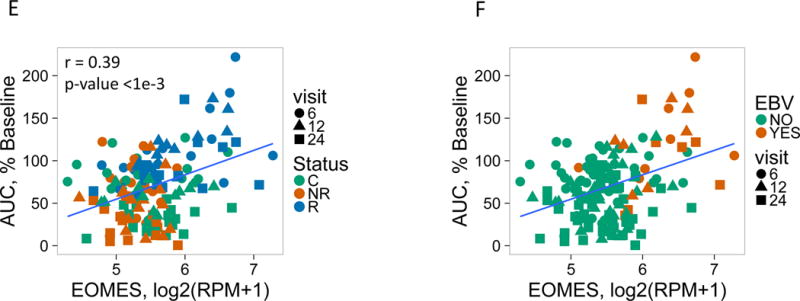
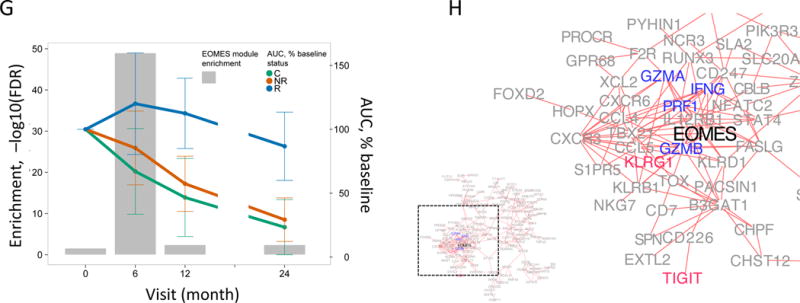
(A) and (B) Bar plots of the overlap between module 559 (A) or EOMES.mod (B) and the 400 top C-peptide-correlated or randomly ordered genes. Dashed line, FDR = 0.05. (C) Blue line, enrichment score for overrepresentation of EOMES.mod genes in a list of all genes ranked by expression in R versus C samples. Solid vertical black lines, positions of EOMES.mod genes in the ranked list. Dashed vertical line, median number of genes. (D) Differential gene expression for R versus C subjects. Blue dots, selected NK/CD8 T cell genes; grey dots, all other genes. Horizontal dashed line, FDR = 0.05; vertical dashed line, log2(fold-change) = 0. (E) EOMES gene expression versus AUC. The p-value was calculated using independent permutation analysis of samples from each visit. (F) EOMES expression versus AUC, colored by EBV reactivation. (G) Overlap of AUC correlated genes (N = 300, Table S2) with the top 300 EOMES-associated genes. The right Y axis shows C-peptide AUC levels (mean + SD). (H) Left, a protein-protein interaction network of the 300 genes most highly correlated with EOMES expression. Right, expanded view of the boxed area.