
Figure 2. Accumulation in R subjects of a CD8 cell subset marked by EOMES, KLRG1, and TIGIT protein expression.
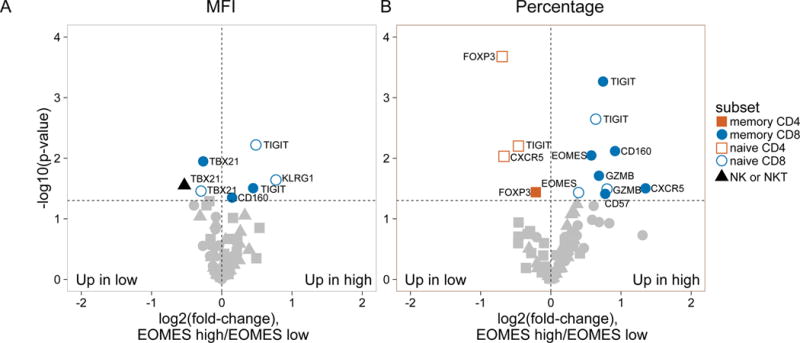
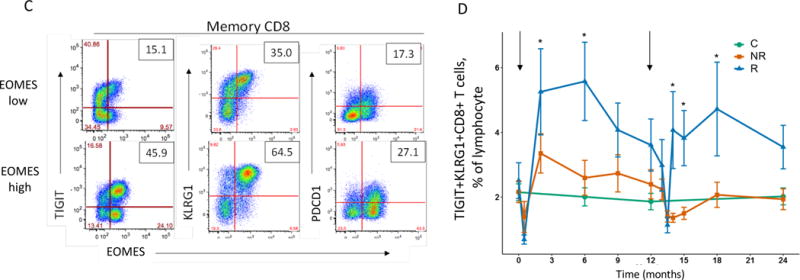
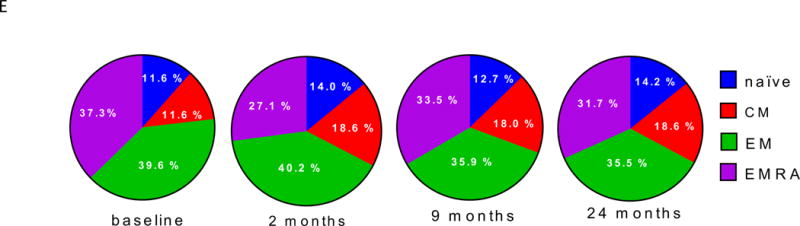
(A) and (B) Differential surface expression of mean fluorescence intensity (MFI) (A) and percentages of marker positive cells (B) in the parent lymphocyte populations. Y axis, −log10(uncorrected p-value), of difference between EOMES high versus EOMES low groups; X axis, log2 fold-change of differences. Dashed horizontal line, p-value = 0.05; dashed vertical line, log(fold-change) = 0. (C) Co-expression of EOMES with TIGIT, KLRG1, or PDCD1 in memory CD8 T cells from EOMES high (bottom row) and EOMES low individuals (top). The frequencies of double high cell populations are shown in the top right quadrant. (D) Longitudinal TIGIT and KLRG1 co-expression in total CD8 T cells from R, NR, and C subjects. Mean ± SEM are shown. Asterisks denote significant differences between R and NR subjects for each visit. Arrows indicate times of initiation of treatment courses. (E) Pie charts of the mean fractions of TIGIT+KLRG1+ cells in each subset at indicated time points.