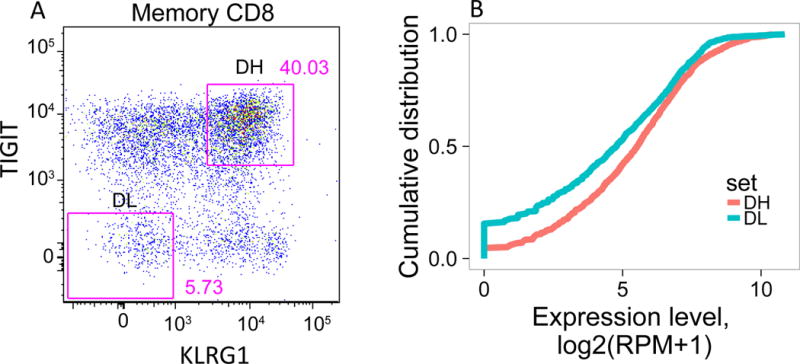
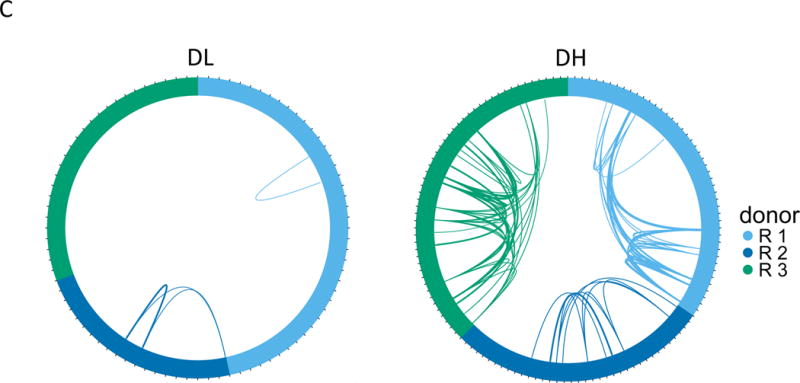
Figure 3. TIGIT+KLRG1+ CD8 memory T cells from R subjects expressed expanded TCRs.


(A) Gating scheme for isolation of TIGIT+KLRG1+ (Double high, DH) and TIGIT-KLRG1- (Double low, DL) populations from CD8 memory (CD8+CD45RO+ of CD3+CD56-) T cells. (B) Cumulative distribution plots for the fraction of EOMES network genes detected (Y axis) versus expression levels (X axis). This plot is representative of the three R subjects tested; the plot comprises 5 replicates for DH cells, and 4 replicates for DL cells from a single individual. (C) Each segment in the plot represents a library (or cell) yielding a TCR junction from DH cells isolated from three R subjects (Table S1, Table S4). Arcs connect cells sharing junctions, with line thickness proportional to the number of junctions shared between cells. Responders 1–3 yielded 56, 44 and 67 unique junctions, respectively, and 4, 5, and 9 expanded junctions (i.e., expressed > 1 cell) for DH cells; and 70, 30, and 49 unique junctions, and 1, 2, and 0 expanded junctions for DL cells.
