
Figure 4. DH cells upregulate multiple inhibitory receptors and down-regulate cell cycle genes during anti-CD3/anti-CD28 stimulation.
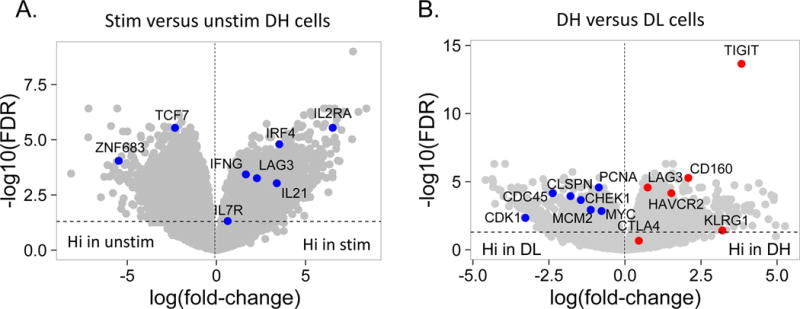
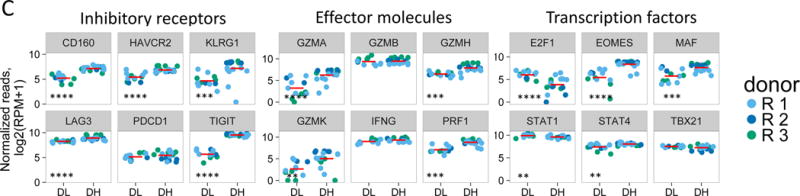
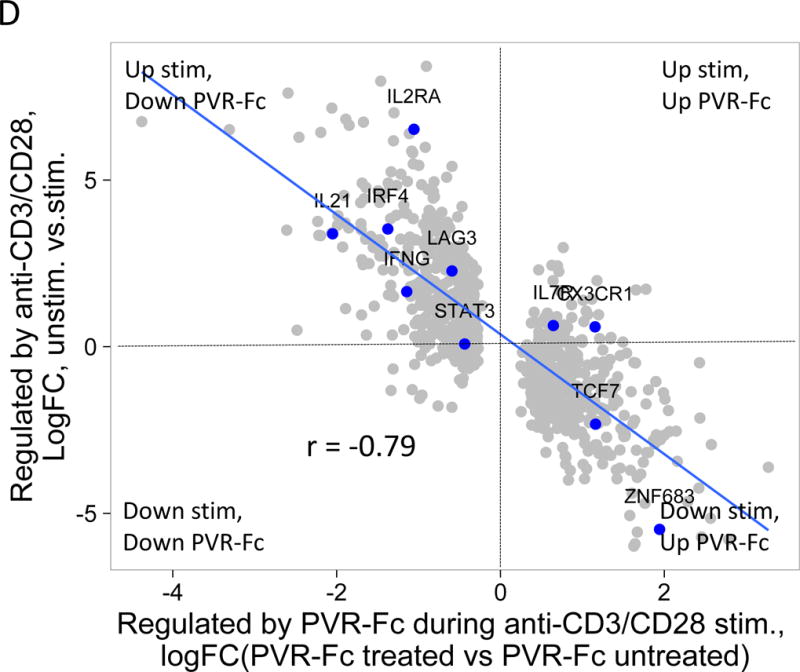
(A) Differential gene expression in anti-CD3/anti-CD28 mAb stimulated versus unstimulated DH cells. Blue dots, selected CD8 T cell genes that correlate with T cell expansion in acute EBV infection (28); grey dots, all other genes Horizontal dashed line, FDR = 0.05; vertical, dashed line, log(fold-change) = 0. (B) Differential gene expression in CD3/anti-CD28 mAb stimulated DH versus DL cells. Red dots, selected inhibitory receptor genes; blue dots, selected cell cycle genes; grey dots, all other genes. (C) Gene expression of selected inhibitory receptors (left panel), effector molecules (center panel) and transcription factors (right panel) in anti-CD3/anti-CD28 stimulated DH and DL cells from three R subjects. Horizontal bars, mean values. Asterisks indicate genes that were detected as differentially expressed by Wilcoxon test (*, p-value <0.05 and ≥0.01; **, p-value <0.01 and ≥0.001; ***, p-value <0.001 and ≥0.0001; ****, p-value <0.0001). (D) Y axis, gene regulation (log(fold-change)) triggered by stimulation of DH cells (Figure 4A); X axis, gene regulation triggered by anti-CD3/anti-CD28 mAbs −/+ soluble PvR-Fc. This projection is restricted to genes regulated significantly under both conditions (FDR<0.05).